. 2020 Aug 27;9:e54928. doi: 10.7554/eLife.54928

Figure 4. Validation by precise genome editing of candidate causal mutations responsible for P3.p cell fate evolution in MA lines.

(a) Summary table of the molecular nature, underlying gene and molecular effect of the candidate mutations. (b) P3.p division frequency after editing the sfrp-1 locus in ancestor HK104 with a repair template coding only for synonymous substitutions (mf178) or introducing the N59H substitution as well (mf177). (c) P3.p division frequency after editing the cdk-8 locus in ancestor PB306 with a repair template coding for synonymous substitutions only (independent edits mf169 and mf170) or introducing the V40A substitution as well (independent edits mf167 and mf168). (d) P3.p division frequency after editing the R09F10.3 locus in ancestor PB306 to reproduce the exact same 16 bp deletion as in MA line 488 (independent edits mf171 and mf172). (e) P3.p division frequency after editing the gcn-1 locus in ancestor N2 to reproduce the exact same 1344 bp deletion as in MA line 516 (independent edits mf165 and mf166). (f) P3.p division frequency after deleting the entire Y75B8A.8 locus in ancestor PB306. Each dot is an independent experiment, with dot size scaled to the number of scored individuals(n). The bar is the mean frequency obtained by pooling all replicates; error bars indicate 95% confidence intervals. For each graph, leftmost panels provide the scores of ancestor and MA lines as reference (identical data to Figure 2b). Different letters indicate a significant difference (Fisher's exact test, fdr level: 0.05).

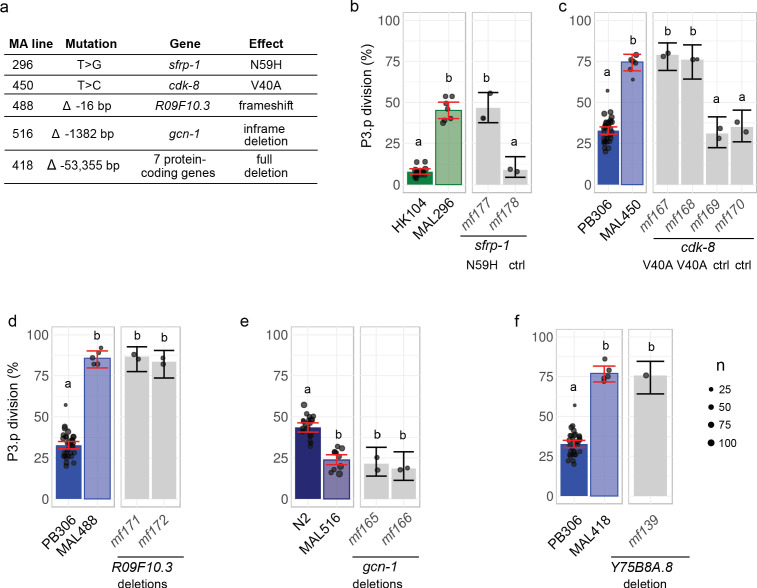
Figure 4.

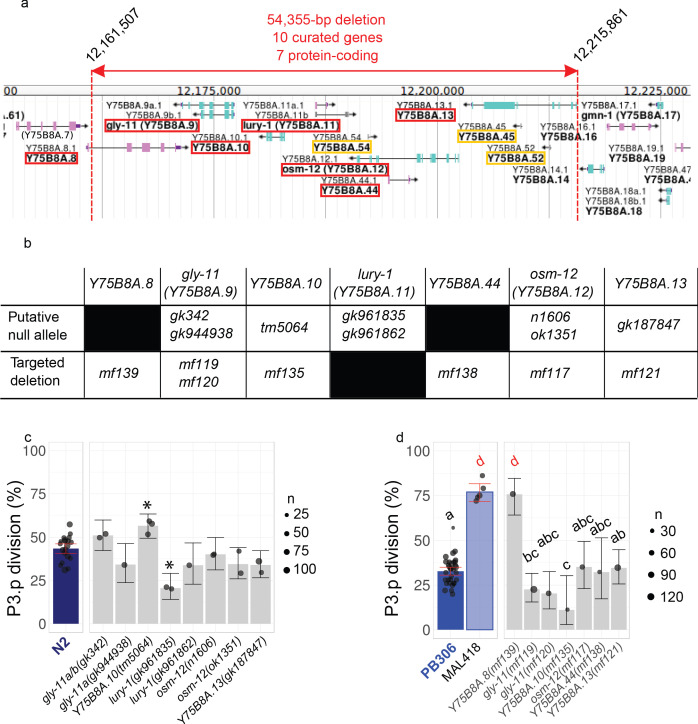
Figure 4—figure supplement 1. P3.p division frequency in mutants of individual genes within the large deletion of MA line 418.

Figure 4—figure supplement 1.

(a) Gene content of the genomic interval containing the candidate deletion identified in MA line 418 (source Wormbase/Jbrowse: rectangles are exons, arrows span open reading frames, green/magenta color indicates the coding strand). Genes altered by the deletion are boxed in red for protein-coding genes and in yellow for non-protein-coding genes. (b) Table of the mutant alleles used to specifically invalidate each protein-coding gene of the interval. (c–d) P3.p division frequency in different lines. Dots are independent experiments; the size of the dot indicates the number of scored individuals. The bar is the mean frequency over all replicates and error bars indicate 95% confidence intervals. The leftmost panels indicate the scores of controls (N2 reference in C and PB306 ancestor and MA line 418 in D; identical data to Figure 2b). (c) P3.p division frequency of mutant lines in N2 background, stars indicate a significant difference with N2 over all experiments (Fisher's exact test, fdr 0.05). (d) P3.p division frequency of edited lines bearing specific gene indels. Different letters indicate a significant difference (Fisher's exact test, fdr 0.05).
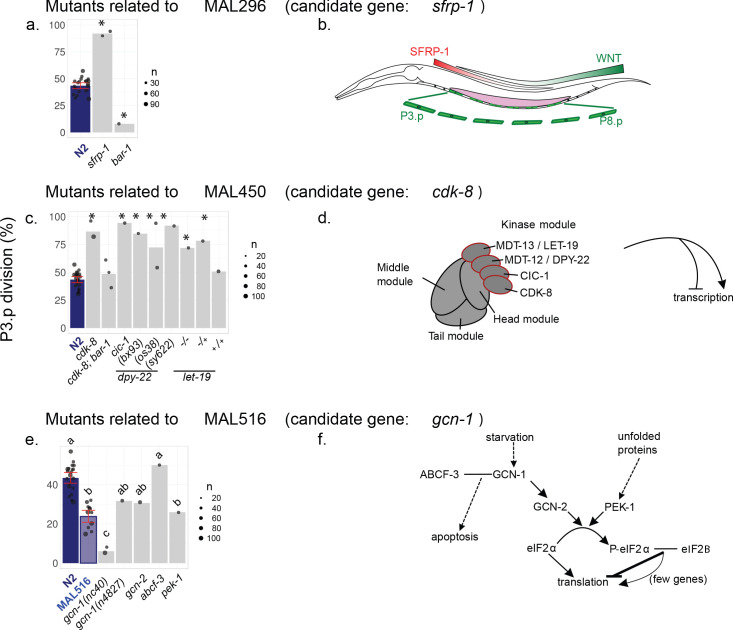
Figure 4—figure supplement 2. P3.p cell fate in different mutants related to the candidate mutation found in MA lines 296 (a), 450 (c) and 516 (e).

Figure 4—figure supplement 2.

All mutants are derived from the N2 laboratory reference strain. Bar charts represent the mean frequency of P3.p division. Each dot is an independent experiment, whose size scales to the number of animals scored (n). Data for N2 (from Figures 24) are repeated on each panel as a reference. Error bars indicate 95% confidence intervals. Stars indicate significant differences with N2 in P3.p division frequency over all experiments and in (e), different letters indicate a significant difference (Fisher's exact test, fdr 0.05). Panels b,d,f provide information about the genes studied in each panel. (b) SFRP-1 expression generates a head-to-tail gradient counter-acting the tail-to-head Wnt gradient. Wnt signaling is known to promote VPC competence and lack of fusion in the L2 stage. (d) Schematic structure of the Mediator complex in C. elegans, made of four multiprotein complexes (head, middle, tail and kinase modules). The Mediator regulates transcription both positively and negatively. Mutants for the four proteins of the kinase module were assayed in (c). (f) Functional pathways related to the GCN-1 kinase in C. elegans. GCN-1 directly activates GCN-2 under starvation condition, which in turns phosphorylates eiF2α leading to a global repression of translation. PEK-1 kinase acts like GCN-2 under unfolded-protein stress. Physical interaction of GCN-1 with ABCF-3 has been shown to promote apoptosis in specific cells, although the involvement of translational regulation is unclear (plain arrows = direct activation, plain T-bar = direct inhibition, dotted arrow = indirect activation, plain line = physical interaction).