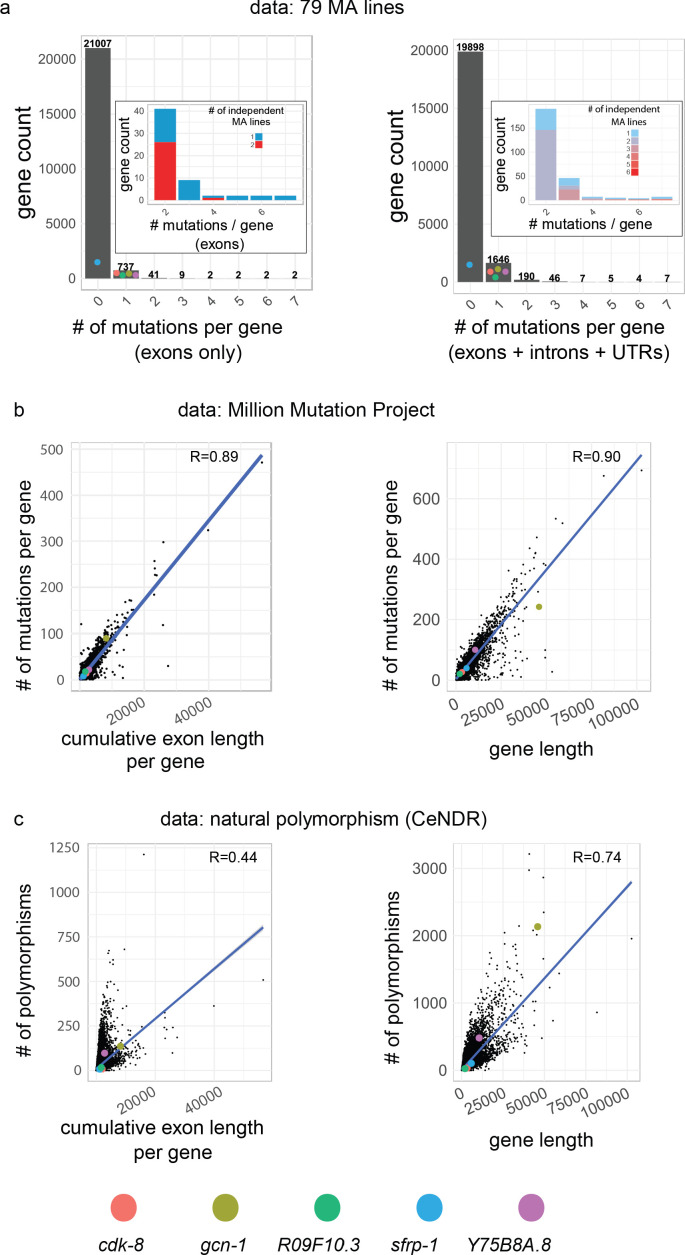
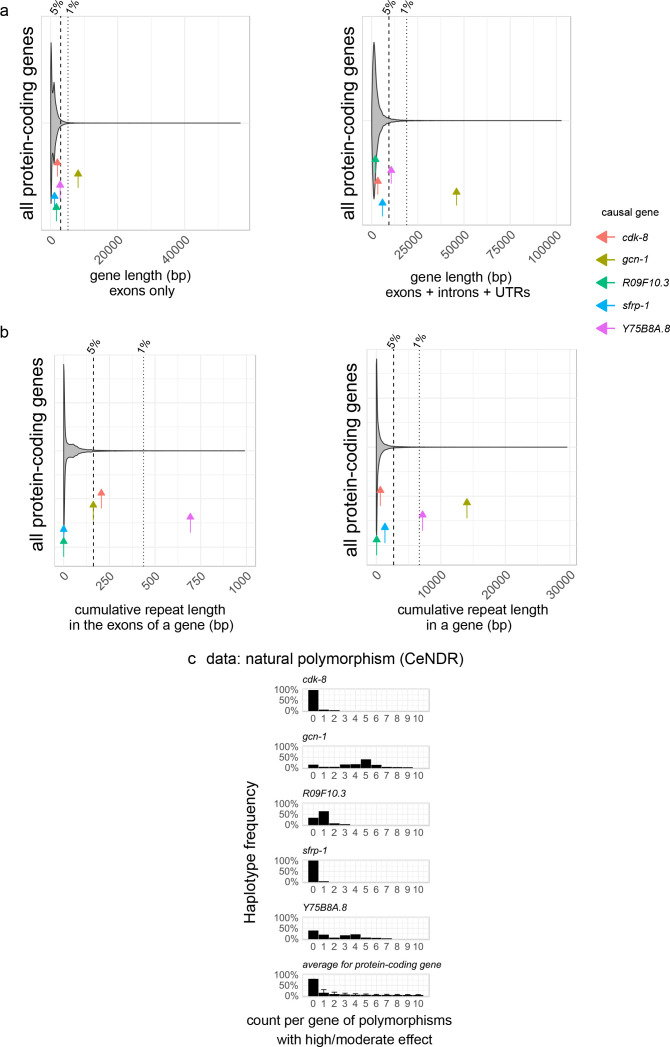
Figure 6. Mutational properties of the five causative genes.
(a) Distribution of number of hits in protein-coding genes in MA lines (this study + 75 lines from Saxena et al., 2019). Throughout the figure, the left panels show cumulative length and mutations of exons only, while the right panels show the length and mutations of genes, defined as the primary transcript sequence (including exons, introns and untranslated regions). Inset focuses on genes with at least two hits, the color code indicating whether hits were found in the same or independent MA lines. Colored dots indicate the value for each causative gene of this study, which were hit only once, except sfrp-1 which was not hit in the C. elegans data set (it was found in aC. briggsae MA line). (b) Correlation between the cumulative exon length (left) and gene length (right) and the number of corresponding mutations in the Million Mutation Project (Thompson et al., 2013). (e) Correlation between the cumulative exon length (left) and gene length (right) and the corresponding number of polymorphic sites, from data from the Caenorhabditis Natural Diversity Resource (CeNDR; Cook et al., 2017). In (b,c), R is the Pearson's correlation coefficient (p-value<2.10−16 in all cases).


