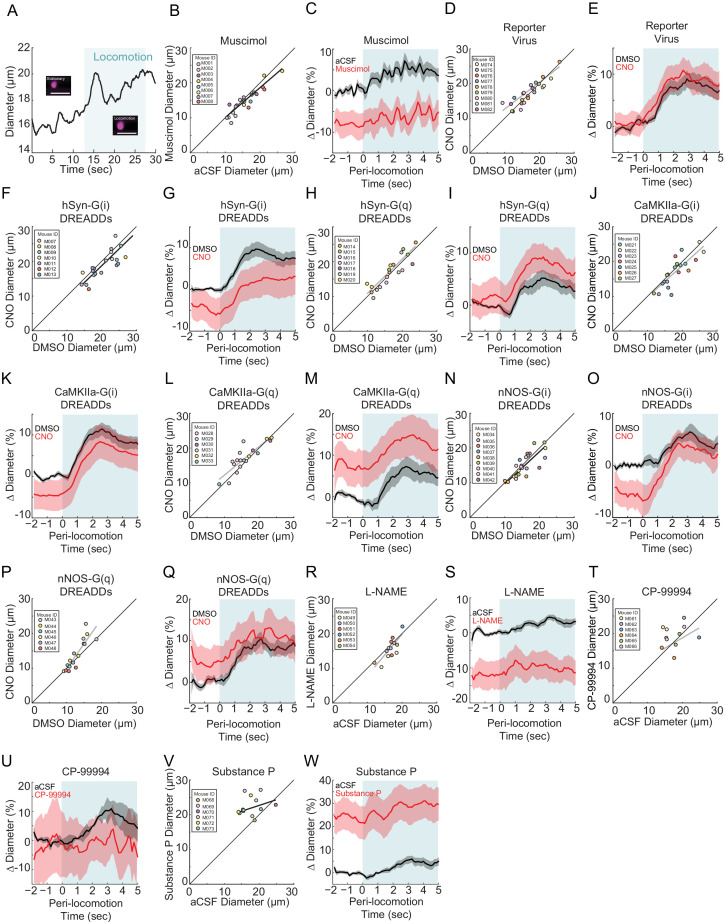
All data is taken from penetrating arterioles imaged ~100 µm below the pial surface. Statistical comparisons of locomotion triggered averages are of the control and manipulation are done with both normalized to the pre-locomotion baseline in the control condition. (A) Example of locomotion-induced dilation in a penetrating arteriole. Inset shows the vessel during a stationary period and during locomotion. Blue shading denotes periods of locomotion. Data in B and C are from penetrating arteries in mice infused with muscimol and aCSF. (B) Basal diameter of penetrating arteries after vehicle infusion (x-axis) versus muscimol infusion (y-axis). There was a significant decrease in basal diameter in the muscimol infused condition (−7.8 ± 1.4%, LME p<0.01 n = 5 mice, 13 vessels). (C) Population locomotion-triggered averages after vehicle (black) and muscimol (red) infusions (LME p<0.35, n = 5 mice, 13 arterioles in FL/HL representation). Data in D and E are from penetrating arteries in mice infected with AAV-CMV-TurboRFP-WPRE-rBG (reporter virus), and IP injected with CNO or vehicle control. (D) Basal arteriole diameter of penetrating arteries after vehicle injection (x-axis) versus CNO injection (y-axis) was not significantly different (−0.3 ± 14.2%, LME p<0.24 n = 5 mice, 13 vessels). (E) Population locomotion-triggered averages for arterioles ≤ 25 µm in basal diameter after vehicle (black) or CNO (red) injection (LME p<1, n = 9 mice, 13 arterioles in FL/HL representation). Data in F and G are from penetrating arteries in mice infected with AAV-hSYN-HA-hM4D(Gi)-mCherry, data in H and I is from penetrating arteries in mice infected with AAV-hSYN-HA-hM3D(Gq)-mCherry (pan-neuronal expression). (F) Basal diameter of penetrating arteries after vehicle injection (x-axis) versus CNO injection (y-axis) was significantly decreased by CNO (−6.7 ± 12.0%, LME p<0.03, n = 7 mice, 21 vessels). (G) Population locomotion-triggered averages after vehicle (black) and CNO (red) injection (LME p<1, n = 7 mice, 21 arterioles in FL/HL representation). (H) Basal diameter of penetrating arteries after vehicle injection (x-axis) versus CNO injection (y-axis). There was no significant difference between the conditions (+2.3 ± 13.9%, LME p<0.92 n = 7 mice, 19 vessels). (I) Population locomotion-triggered averages after vehicle (black) and CNO (red) injection (LME p<1, n = 7 mice, 19 arterioles in FL/HL representation). Data in J and K are from penetrating arteries in mice infected with AAV-CaMKIIa-hM4D(Gi)-mCherry, data in L and M is from penetrating arteries in mice infected with AAV-CaMKIIa-hM4D(Gq)-mCherry (expression in pyramidal neurons). (J) Basal arteriole diameter of penetrating arteries after vehicle injection (x-axis) versus CNO injection (y-axis) showed no significant difference (−4.1 ± 13.5%, LME p<0.06 n = 7 mice, 20 vessels). (K) Population locomotion-triggered averages after vehicle (black) and CNO (red) injection (LME p<1, n = 7 mice, 20 arterioles in FL/HL representation). (L) Basal arteriole diameter of penetrating arteries after vehicle injection (x-axis) versus CNO injection (y-axis) showing significant increases (+8.5 ± 14.6%, LME p<0.04 n = 7 mice, 18 vessels). (M) Population locomotion-triggered averages after vehicle (black) and CNO (red) injection (LME p<0.83, n = 7 mice, 18 arterioles in FL/HL representation). Data in N and O are from penetrating arteries in nNOS-cre mice injected with AAV-hSyn-DIO-hM4D(Gi)-mCherry, data in P and Q is from penetrating arteries in nNOS-cre mice injected with AAV-hSyn-DIO-hM4D(Gq)-mCherry (nNOS+ expression). (N) Basal diameter of penetrating arteries after vehicle injection (x-axis) versus CNO injection (y-axis) showing no significant difference (−7.5 ± 12.6%, LME p<0.24 n = 9 mice, 23 vessels). (O) Population locomotion-triggered averages after vehicle (black) and CNO (red) injection (LME p<1, n = 9 mice, 23 arterioles in FL/HL representation). (P) Basal diameter of penetrating arteries after vehicle injection (x-axis) versus CNO injection (y-axis) showing no significant difference (+7.3 ± 16.4%, LME p<0.12 n = 6 mice, 16 vessels). (Q) Population locomotion-triggered averages after vehicle (black) and CNO (red) injection (LME p<1, n = 6 mice, 16 arterioles in FL/HL representation). Data in R and S are from penetrating arteries in mice after L-NAME and aCSF infusions. (R) Basal diameter of penetrating arteries after vehicle infusion (x-axis) versus L-NAME infusion (y-axis). There was no significant change in arterial diameter (−14.8 ± 10.9%, LME p<0.08 n = 6 mice, 14 vessels). (S) Population locomotion-triggered averages after vehicle (black) and L-NAME (red) infusion (LME p<0.07, n = 6 mice, 14 arterioles in FL/HL representation). Data in T and U are from penetrating arteries in mice after CP-99994 and aCSF infusions. Data in V and W is from penetrating arteries in mice after Substance P and aCSF infusions. (T) Basal arteriole diameter of penetrating arteries after vehicle infusion (x-axis) versus CP-99994 infusion (y-axis) showing no significant difference (5.4 ± 23.6%, LME p<0.53 n = 6 mice, 11 vessels). (U) Population locomotion-triggered averages after vehicle (black) and CP-99994 (red) infusion (LME p<1, n = 6 mice, 11 arterioles in FL/HL representation). (V) Basal arteriole diameter of penetrating arteries after vehicle infusion (x-axis) versus Substance P infusion (y-axis) showing diameter was significantly increased by Substance P (23.3 ± 22.3%, LME p<1.6×10⁻³ n = 6 mice, 13 vessels). (W) Population locomotion-triggered averages after vehicle (black) and Substance P (red) infusion (LME p<0.05, n = 6 mice, 13 arterioles in FL/HL representation).
