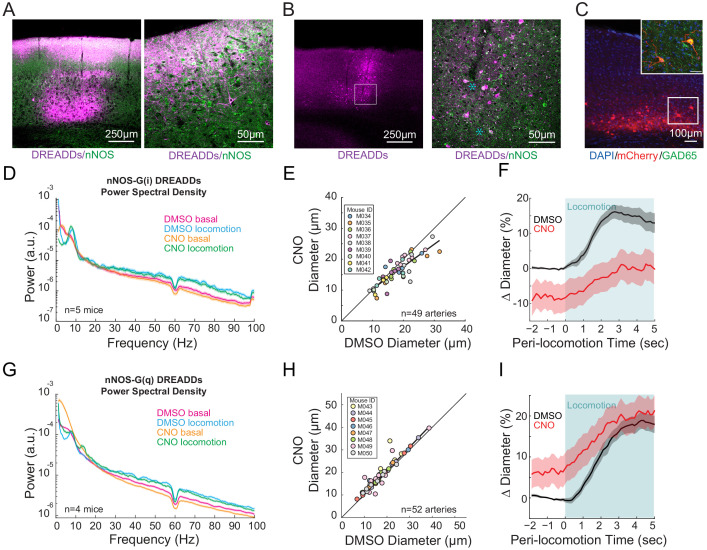
Figure 4. nNOS expressing neurons controls arteriole diameter independent of overall neural activity.
(A) Representative image of cortex taken of AAV-hSyn-DIO-hM3D(Gq)-mCherry in nNOS-cre mice, where DREADDs expressed in nNOS+ cells. The mCherry label is magenta, nNOS antibody is green. Co-labeling in processes in cell bodies shows up as white. Blue asterixis denote putative type 1 nNOS neurons. Dark vertical streaks are blood vessels. (B) Left, wide-field image of DREADD-infected somatosensory cortex. Right, enlargement of area in the white box, showing expression around blood vessel. (C) Left image is wide-field image of nNOS-mCherry DREADDs expression (red) in cortex with DAPI (blue) staining. Scale bar 100 μm. Right image is zoomed image of nNOS-mCherry DREADDs virus (red) in cortex with DAPI (blue) and GAD65 (green) staining, Scale bar 30 μm. Data in D-F are from nNOS-cre mice injected with AAV-hSyn-DIO-hM4D(Gi)-mCherry, data in G-I is from nNOS-cre injected with AAV-hSyn-DIO-hM4D(Gq)-mCherry. (D) LFP power spectra during stationary periods (basal) and locomotion after CNO injection in nNOS G(i) DREADDs mice, normalized to vehicle injection of the same mouse. (E) Plot of basal arteriole diameter after vehicle injection (x-axis) versus CNO injection (y-axis). (F) Population locomotion-triggered diameter averages after vehicle and CNO injections for arterioles ≤ 25 µm in basal diameter. (G) LFP power spectra during stationary periods (basal) and locomotion after CNO injection in nNOS G(q) DREADDs mice. (H) Plot of basal arteriole diameter after vehicle injection (x-axis) versus CNO injection (y-axis). (I) Population locomotion-triggered averages after vehicle and CNO injections for arterioles ≤ 25 µm in basal diameter.


