. 2020 Oct 5;9:e60533. doi: 10.7554/eLife.60533

Figure 5. Type I nNOS expressing neurons control basal arteriole diameter.

Data in A-C are from mice after local CP-99994 infusions, which will block the excitatory Substance P receptors on type1 nNOS neurons, data in D-E is from mice after Substance P infusions, which will excite Type1 nNOS neurons. (A) LFP power spectra during stationary (basal) and locomotion periods after CP-99994 infusion, normalized to vehicle infusion in the same mouse. (B) Plot of basal arteriole diameter after vehicle (x-axis) versus CP-99994 infusion (y-axis). (C) Population locomotion-triggered averages after vehicle or CP-99994 infusions for arterioles ≤ 25 µm in basal diameter. (D) LFP power spectra during stationary (basal) and locomotion periods after Substance P infusion, normalized to vehicle infusion in the same mouse. (E) Plot of basal arteriole diameter after vehicle infusion (x-axis) versus Substance P infusion (y-axis). (F) Population locomotion-triggered averages after vehicle or Substance P infusions for arterioles ≤ 25 µm in basal diameter. (G) Plot of basal arteriole diameter after vehicle infusion (x-axis) versus muscimol and Substance P infusion (y-axis). (H) Locomotion-triggered averages after vehicle or muscimol/Substance P infusions for arterioles ≤ 25 µm in basal diameter.

Figure 5.

Figure 5—figure supplement 1. No significant effect of chemogenetic manipulation of astrocytes on basal vessel diameter or neural activity.

Figure 5—figure supplement 1.

(A) Representative cortical sections showing mCherry expressing cells (red), GFAP staining (green), and cell nuclei (DAPI, blue). Scale bar is 100 μm. AAV-hSyn-DIO-hM3D(Gq)-mCherry in Aldh1L1-cre mice, where DREADDs are expressed in astrocytes. Data in B-D are from mice injected with AAV-hSyn-DIO-hM3D(Gi)-mCherry in Aldh1L1-cre mice, where DREADDs are expressed in astrocytes. (B) LFP power spectra during stationary periods (basal) and locomotion after CNO injection, normalized to vehicle injection in the same mouse. The fluorescent reporter virus does not significantly change neural activity in the gamma band (basal −20 ± 32.4%, p<0.53; locomotion, −5.2 ± 16.0%, p<0.3, n = 3). (C) Plot of basal arteriole diameter after vehicle injection (x-axis) versus CNO injection (y-axis). There were no significant changes in basal diameter (+4.3 ± 13.2%, LME p<0.64, n = 5 mice, 24 vessels). (D) Locomotion-triggered averages after vehicle (black, 17.0 ± 3.7%) and CNO (red, 21.4 ± 6.4%) injections (LME p<1, n = 5 mice, 19 arterioles in FL/HL representation) for arterioles ≤ 25 µm in basal diameter. Data in E-G are from mice injected with AAV-hSyn-DIO-hM3D(Gq)-mCherry in Aldh1L1-cre mice, where DREADDs expressed in astrocytes. (E) LFP power spectra during stationary periods (basal) and locomotion after CNO injection, normalized to vehicle injection in the same mouse. The CNO injection did not significantly change neural activity in the gamma band (basal −7.6 ± 3.6%, p<0.09; locomotion, +4.2 ± 4.2%, p<0.56, n = 4). (F) Plot of basal arteriole diameter after vehicle injection (x-axis) versus CNO injection (y-axis). There were no significant changes in basal diameter (+9.7 ± 28.9%, LME p<0.44 n = 7 mice, 31 vessels). (G) Locomotion-triggered averages after vehicle (black, 23.7 ± 2.8%) and CNO (red, 27.1 ± 5.6%) injections (LME p<1, n = 7 mice, 20 arterioles in FL/HL representation) for arterioles ≤ 25 µm in basal diameter.
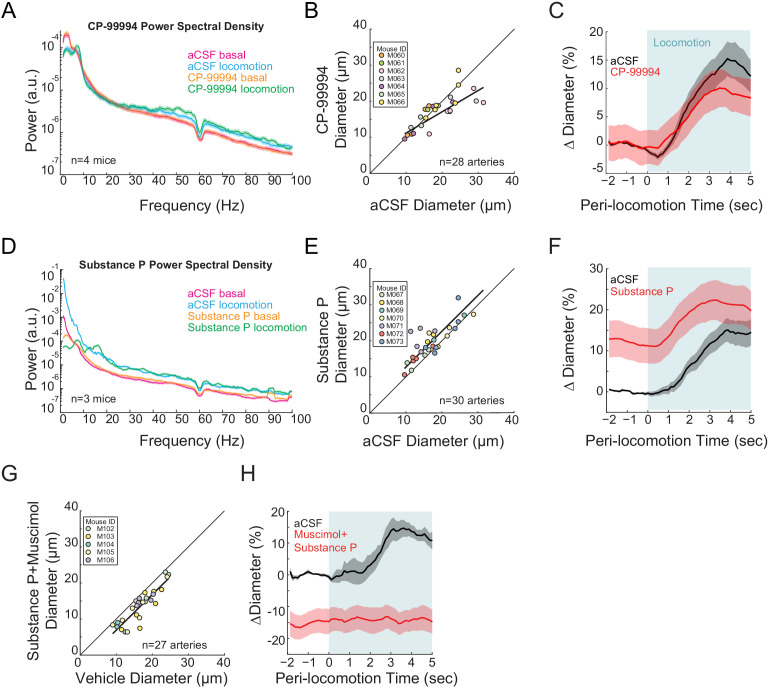
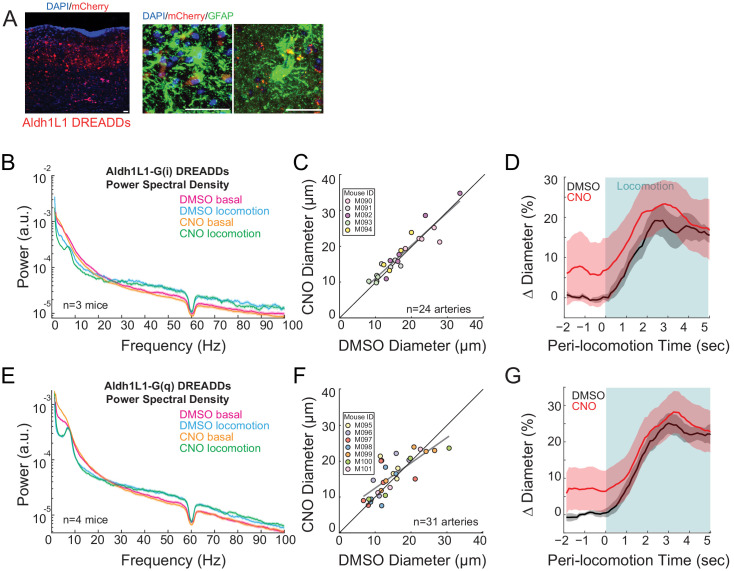
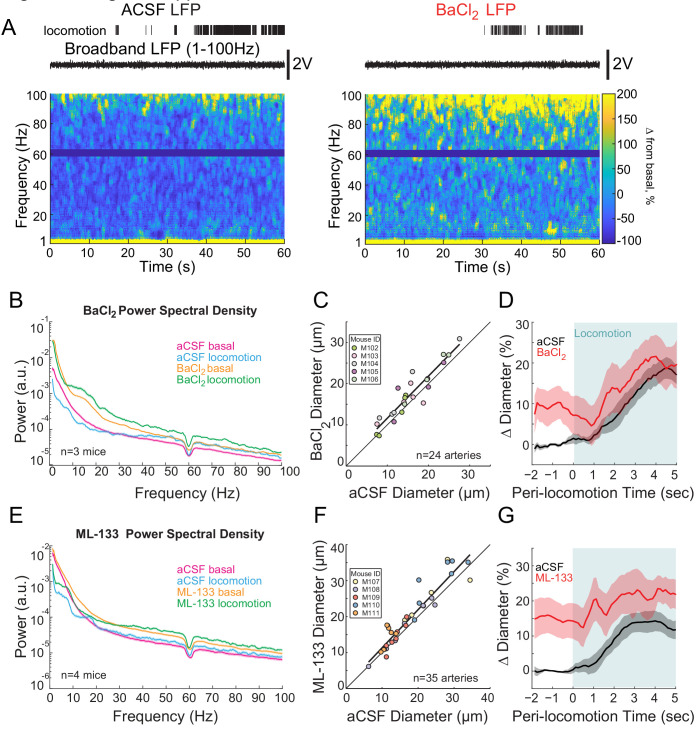
Figure 5—figure supplement 2. Kir-channel blockers increase in neural activity and basal arterial diameter.

Figure 5—figure supplement 2.

(A) Representative trial after vehicle (left) or BaCl2 (right) infusion (Kir-channel blocker). BaCl2 infusion-induced epileptic-like activity. Locomotion events are denoted with shading. (B) LFP power spectra during stationary periods (basal) and locomotion after BaCl2 infusion, normalized to vehicle infusion in the same mouse. (C) Plot of basal arteriole diameter after vehicle infusion (x-axis) versus BaCl2 infusion (y-axis). The linear regression (black) was significantly different from the unity line. (D) Population locomotion-triggered average after vehicle (black) and BaCl2 (red) infusions for arterioles ≤ 25 µm in basal diameter. For both cases, the diameters were normalized by the average basal diameter of the vessel after vehicle infusion. (E) LFP power spectra during stationary periods (basal) and locomotion after ML-133 infusion, normalized to vehicle infusion in the same mouse. (F) Plot of basal arteriole diameter after vehicle infusion (x-axis) versus ML-133 infusion (y-axis). The linear regression (black) is significantly different from the unity line. (G) Locomotion-triggered averages after vehicle (black) and ML-133 (red) infusions for arterioles ≤ 25 µm in basal diameter. For both cases, the diameters were normalized by the average basal diameter of the vessel after vehicle infusion.