. 2020 Oct 5;9:e60533. doi: 10.7554/eLife.60533

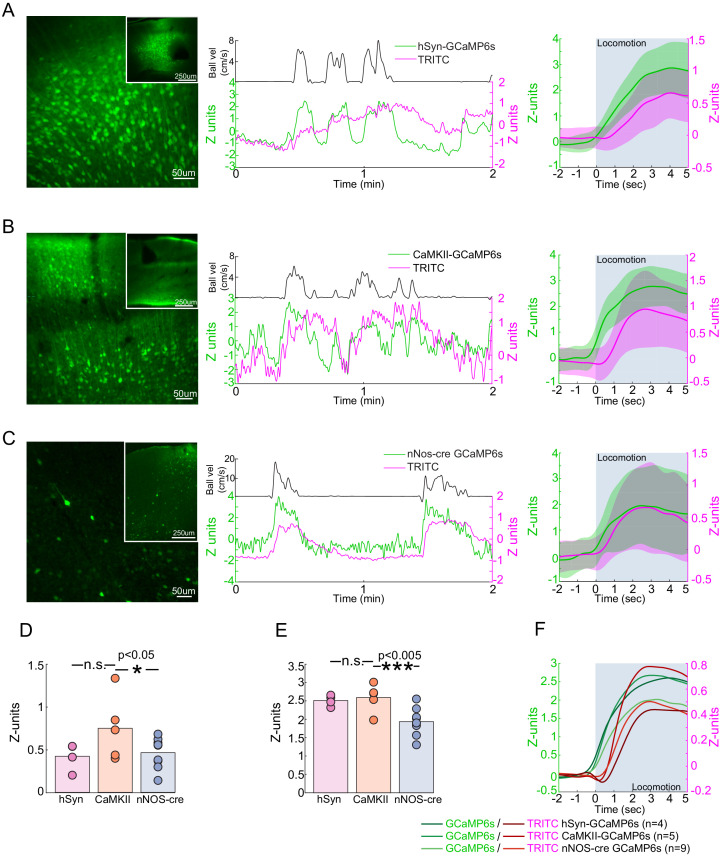
Figure 7. Locomotion-evoked Ca2+ signals in neurons.

(A–C) Left, a representative image of cortex taken of AAV-hSyn-GCaMP6s in C57BL/6J mice (A), AAV-CaMKII-GCaMP6s in C57BL/6J mice (B) and AAV-Syn-FLEX-GCaMP6s in nNOS-cre mice. Note that there are substantially fewer cells labeled in AAV-Syn-FLEX-GCaMP6s in nNOS-cre mice. Center, a representative trace of TRITC (blood volume - magenta) and GCaMP6s (green) changes evoked by a single locomotion event (black trace above). Right, average locomotion-evoked blood volume and GCaMP6s changes of events >5 s and <10 s in duration from the example animal. Locomotion period shaded in blue. (D) Population average locomotion-evoked blood volume change. Bars are population mean of each GCaMP6s sub-type; circles are individual animal averages. (E) Population average locomotion-evoked GCaMP6s fluorescence change. Bars are population mean of each GCaMP6s sub-type; circles are individual animal averages. (F) Population average trace of locomotion-evoked changes in blood volume (red) and GCaMP (green) fluorescence. Period of locomotion is shaded in blue.

Figure 7.

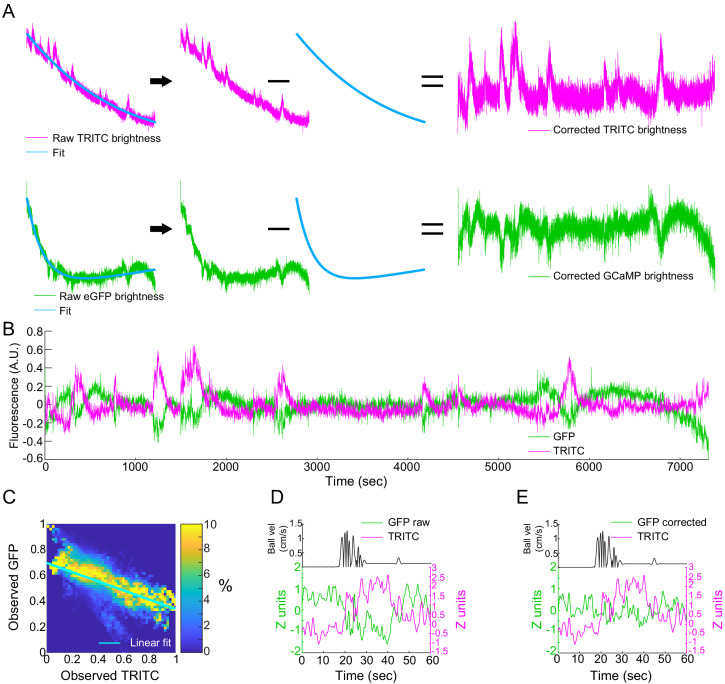
Figure 7—figure supplement 1. Locomotion-evoked Ca2+ signals in nNOS neurons, correction of photobleaching and hemodynamic attenuation of GCaMP signals.

Figure 7—figure supplement 1.

(A) Representative example of raw GFP (green) and TRITC (magenta) fluorescence obtained using fiber photometry in B6.CAG-eGFP mice, which express GFP ubiquitously in their tissues. TRITC fluorescence will track blood volume. The decay of the signal is fit as a sum of two exponential functions and this fit is subtracted from raw signals. (B) A representative trace of blood volume (magenta) and GFP (green) changes after correction for slow signal intensity decay prior to correction of blood volume induced attenuation of GFP signal intensity. (C) Histogram showing the relationship between TRITC (x-axis) and GFP fluorescence (y-axis). Color shows % of events within a column in each bin. Linear fit of GFP-TRITC relationship (blue line) is used to scale CBV signal prior to subtraction from GFP/GCaMP6s signals in all animals. (D) Single locomotion event evoked changes in GFP (green) and blood volume (magenta) signal intensity prior to correction of GFP signal. (E) Single locomotion event evoked changes in GFP (green) and TRITC (magenta) signal intensity after correction of blood volume induced changes in eGFP fluorescence.
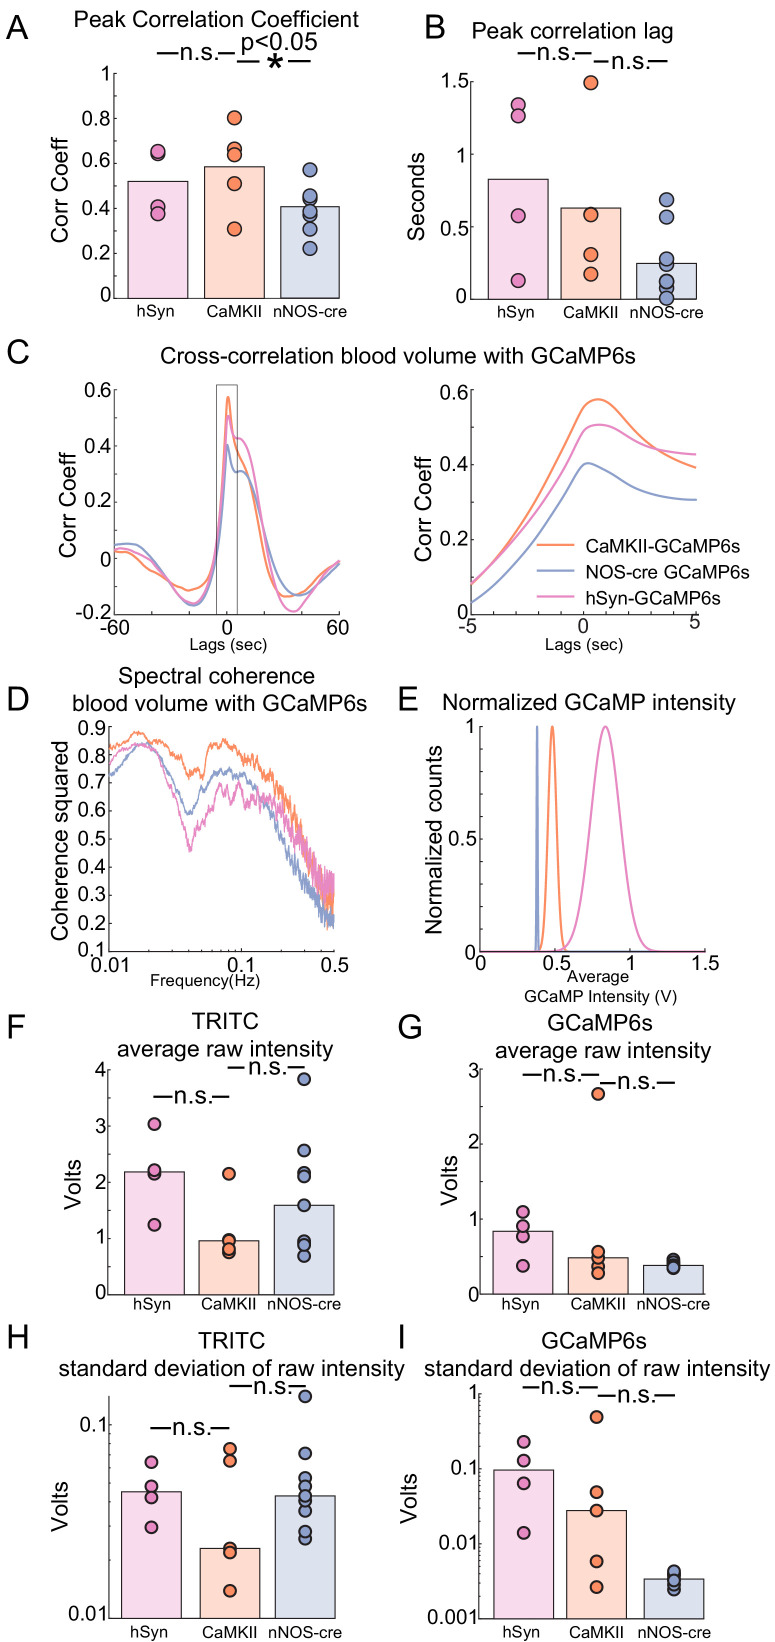
Figure 7—figure supplement 2. Cross-correlation, coherence, and signal-to-noise comparisons for fiber photometry signals.

Figure 7—figure supplement 2.

(A) Population averaged peak correlation coefficient between blood volume and GCaMP6s fluorescence signals across all behaviors. Bars are population mean of each GCaMP6s sub-type; circles are individual animal averages. hSyn: 0.54 ± 0.14, LME difference from CaMKII: p<0.7, CaMKII: 0.60 ± 0.17, nNOS: 0.43 ± 0.11, LME difference from CaMKII: p<0.02. (B) Population average, lag time of peak correlation coefficient between blood volume and GCaMP6s fluorescence signals across all behaviors. Bars are population mean of each GCaMP6s sub-type; circles are individual animal averages. hSyn: 0.79 ± 0.57 s, LME difference from CaMKII: p<0.60 CaMKII: 0.60 ± 0.52 s, nNOS: 0.24 ± 0.23 s, LME difference from CaMKII: p<0.09. (C) Population average traces of time lagged cross correlation between blood volume and GCaMP of ±60 s and ±5 s windows. (D) Population average traces of cross spectral frequency coherence between blood volume and GCaMP6s fluorescence signals. (E) Population average traces of normalized gaussian distribution of GCaMP6s fluorescence signals based on sub-type. (F) Population median of, average raw blood volume intensity across all behaviors. Bars are population median of each GCaMP6s sub-type; circles are individual animal averages. hSyn: 2.16 ± 0.73, LME difference from CaMKII: p<0.07 CaMKII: 1.13 ± 0.58, nNOS: 1.75 ± 1.03, LME difference from CaMKII: p<0.18. (G) Population median of, average raw GCaMP6s intensity across all behaviors. Bars are population median of each GCaMP6s sub-type; circles are individual animal averages. hSyn: 0.79 ± 0.30, LME difference from CaMKII: p<0.81 CaMKII: 0.87 ± 1.01, nNOS: 0.39 ± 0.04, LME difference from CaMKII: p<0.1. (H) Population median of, standard deviation of raw blood volume intensity across all behaviors. Bars are population median of each GCaMP6s sub-type; circles are individual animal averages. hSyn: 0.05 ± 0.01 s, LME difference from CaMKII: p<0.56, CaMKII: 0.04 ± 0.00.03, nNOS: 0.05 ± 0.04 s, LME difference from CaMKII: p<0.33. (I) Population median of, standard deviation of raw GCaMP intensity across all behaviors. Bars are population median of each GCaMP6s sub-type; circles are individual animal averages. hSyn: 0.11 ± 0.09, LME difference from CaMKII: p<0.68 CaMKII: 0.16 ± 0.21, nNOS: 0.003 ± 6×10⁻⁴, LME difference from CaMKII: p<0.08.
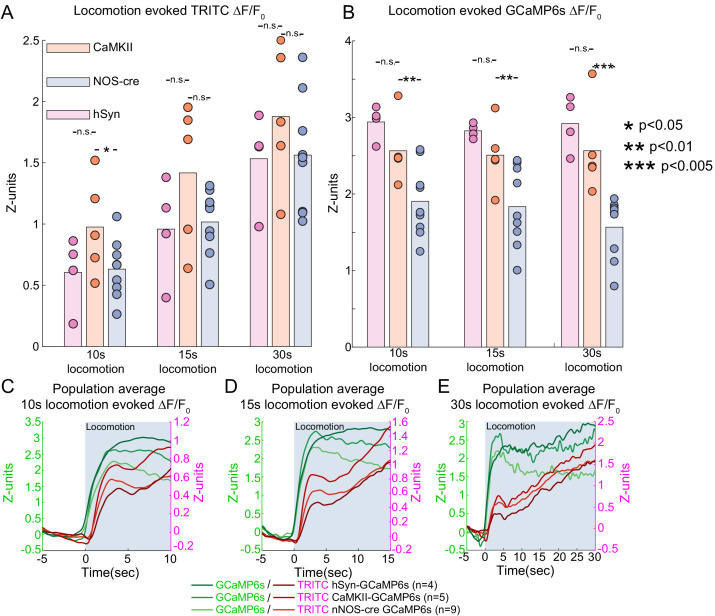
Figure 7—figure supplement 3. Sustained locomotion-evoked Ca2+ signals in nNOS neurons during long duration locomotion events.

Figure 7—figure supplement 3.

(A) Population average locomotion-evoked blood volume change of events of increasing duration. Bars are population mean of each GCaMP6s sub-type; circles are individual animal averages. Population TRITC intensity change (z-units), hSyn- 10 s:0.61 ± 0.30, 15 s: 0.96 ± 0.42, 30 s: 1.53 ± 0.39; CaMKII- 10 s:0.98 ± 0.40, 15 s: 1.42 ± 0.58, 30 s: 1.88 ± 0.57; nNOS- 10 s:0.63 ± 0.24, 15 s: 1.02 ± 0.26, 30 s: 1.56 ± 0.46. (B) Population average locomotion-evoked GCaMP6s fluorescence change. Bars are population mean of each GCaMP6s sub-type; circles are individual animal averages. Population GCaMP intensity change (z-units), hSyn- 10 s:2.94 ± 0.22, 15 s: 2.83 ± 0.09, 30 s: 2.92 ± 0.36; CaMKII- 10 s:2.56 ± 0.43, 15 s: 2.50 ± 0.43, 30 s: 2.57 ± 0.59; nNOS- 10 s:1.90 ± 0.46, 15 s: 1.84 ± 0.52, 30 s: 1.57 ± 0.40. (C–E) Population average traces of locomotion-evoked blood volume (red) and GCaMP (green) fluorescence changes for 10, 15, and 30 s minimum periods of locomotion. Period of locomotion is shaded in blue.