. 2020 Oct 5;9:e60533. doi: 10.7554/eLife.60533

Figure 8. Relationship between neural activity and arterial diameter.

(A) Summary showing the gamma-band power vs. arteriole diameter, normalized to the relevant vehicle control for each condition. Lines connect mean basal and locomotion neural/arterial responses for each condition. Note the large differences in arterial diameter for similar levels of neural activity (e.g. nNOS-G(q) vs. nNOS-G(i)). A linear regression of all the points in the physiologically-relevant range (excluding muscimol), was not significant (p<0.12). For chemogenetic manipulations, neural activity and basal arterial dilation have been shifted so that the reporter virus expressing animals (mCherry) are centered at the origin.

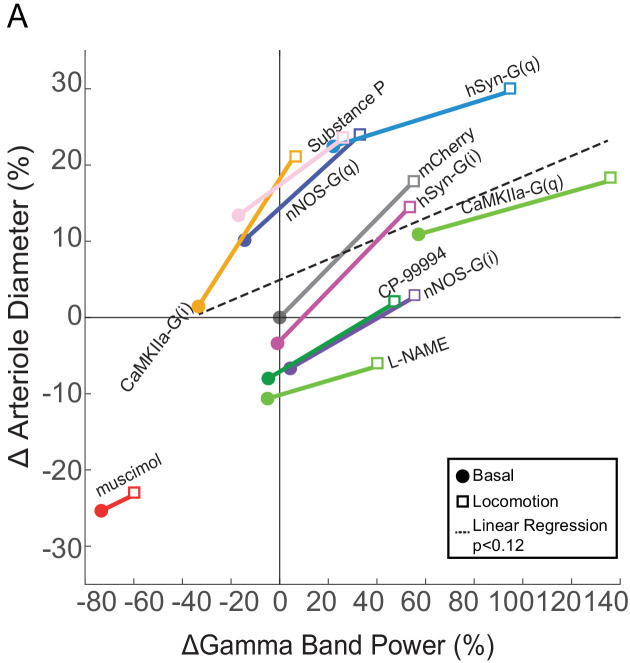
Figure 8.

Figure 8—figure supplement 1. Examples of chemogenetic and pharmacological effects on arteriole diameters.

Figure 8—figure supplement 1.

Examples of two-photon images of arterioles (scale bar 30 μm) after vehicle treatment (gray box) and after chemogenetic/pharmacological treatment (red box). The white arrow shows region where the diameter measurement was made.
Figure 8—figure supplement 2. Relationship between arterial diameter and LFP power at lower frequencies.

Figure 8—figure supplement 2.

(A) Summary showing the change in 10–40 Hz band power vs. arteriole diameter, normalized to the relevant vehicle control for each condition. Lines connect basal and locomotion for each condition. A linear regression of all the points in the physiologically relevant range (excluding muscimol) (R2 = 0.04, p<0.04). For chemogenetic manipulations, neural activity and basal arterial dilation have been shifted so that the reporter virus expressing animals (mCherry) are centered at the origin. (B) Summary showing the change in 1–10 Hz band power vs. arteriole diameter, normalized to the relevant vehicle control for each condition. Lines connect basal and locomotion for each condition. A linear regression of all the points in the physiologically relevant range (excluding muscimol) (R2 = 0.03, p<0.05). For chemogenetic manipulations, neural activity and basal arterial dilation have been shifted so that the reporter virus expressing animals (mCherry) are centered at the origin.
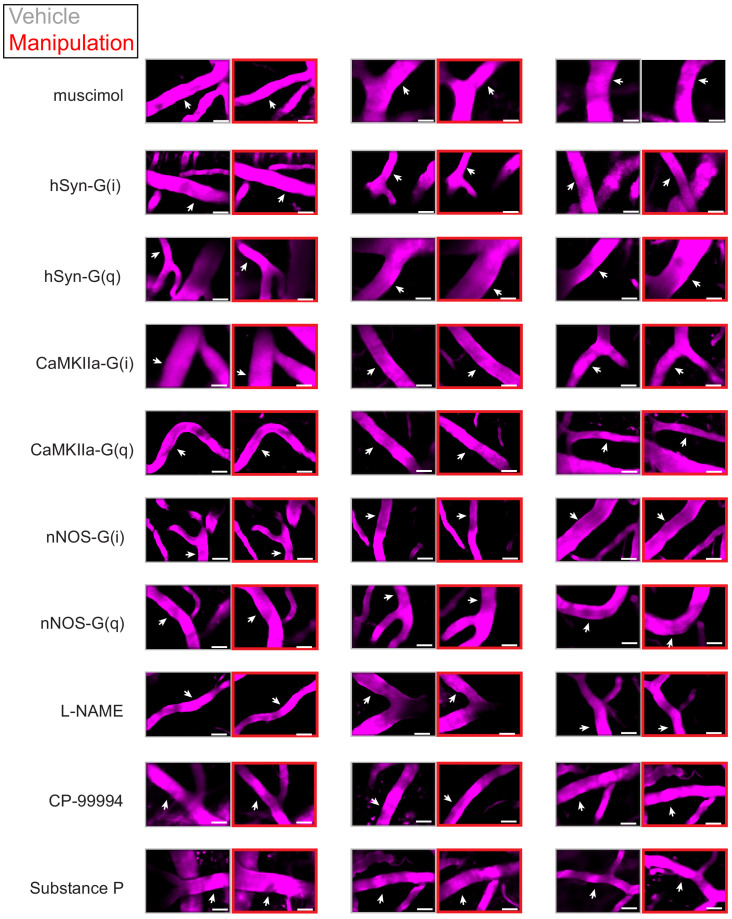
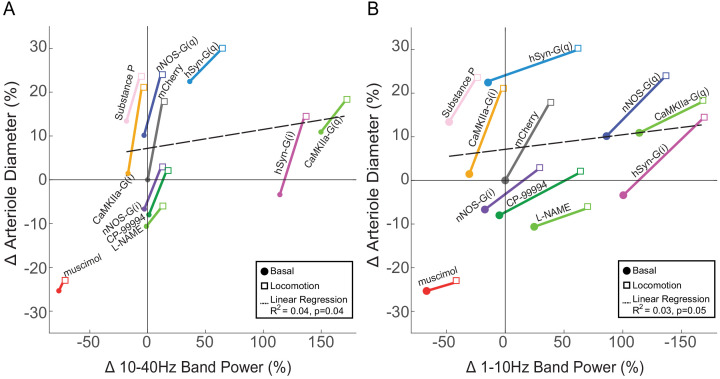
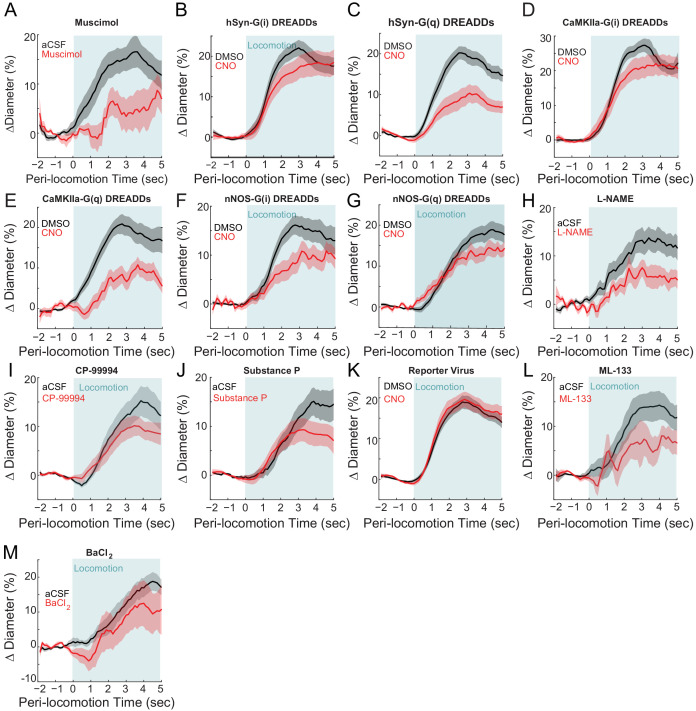
Figure 8—figure supplement 3. The effects of chemogenetic and pharmacological infusions on evoked arterial diameter changes normalized to the baseline within condition.

Figure 8—figure supplement 3.

For the locomotion-triggered averages here, instead of being normalized to the arteriole baseline for the vehicle condition, the baseline dimeter during the manipulation (e.g. CNO or drug) was used. Baseline changes can mask changes in evoked amplitude when measure ratiometrically. (A) muscimol, vehicle 15.8 ± 2.7%, muscimol 4.4 ± 0.3%, LME p<0.04, n = 6 mice. (B) hSyn-G(i) DREADDs, vehicle 20.5 ± 2.0%, CNO 17.8 ± 2.8%, LME p<1, n = 7 mice. (C) hSyn-G(q) DREADDs, vehicle 18.6 ± 1.7%, CNO 9.7 ± 2.1%, LME p<7.1×10⁻³, n = 7 mice. (D) CaMKIIa-G(i) DREADDs, vehicle 25.3 ± 1.9%, CNO 21.4 ± 3.0%, LME p<1, n = 7 mice. (E) CaMKIIa-G(q) DREADDs, vehicle 19.1 ± 2.3%, CNO 9.0 ± 2.1%, LME p<0.06, n = 6 mice. (F) nNOS-G(i) DREADDs, vehicle 15.3 ± 2.0%, CNO 9.8 ± 2.1%, LME p<0.26, n = 9 mice. (G) nNOS-G(q) DREADDs, vehicle 17.4 ± 1.8%, CNO 13.1 ± 1.8%, LME p<0.94, n = 6 mice. (H) L-NAME, vehicle 13.1 ± 2.3%, L-NAME 6.1 ± 2.2%, LME p<0.5, n = 6 mice. (I) CP-99994, vehicle 13.7 ± 2.6%, CP-99994 9.8 ± 2.1%, LME p<1, n = 7 mice. (J) Substance P, vehicle 13.0 ± 2.2%, Substance P 8.7 ± 2.3%, LME p<1, n = 7 mice. (K) Reporter virus, vehicle 17.7 ± 1.5%, CNO 18.3 ± 1.9%, LME p<1, n = 12 mice. (L) ML-133, vehicle 14.0 ± 3.0%, ML-133 6.0 ± 3.3%, LME p<1, n = 5 mice. (M) BaCl2, vehicle 15.1 ± 2.7%, BaCl211.1 ± 5.5%, LME p<1, n = 5 mice.