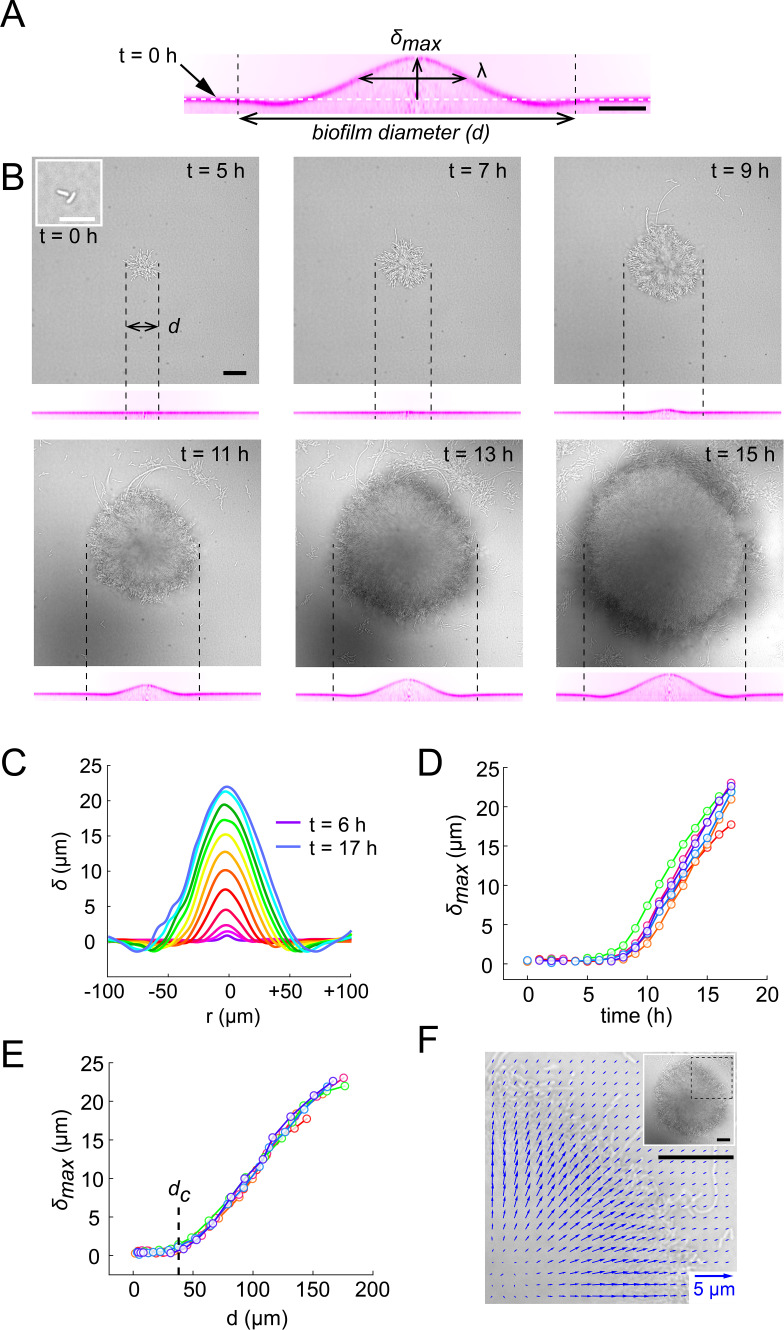
Figure 2. Biofilms deform their substrate by buckling.
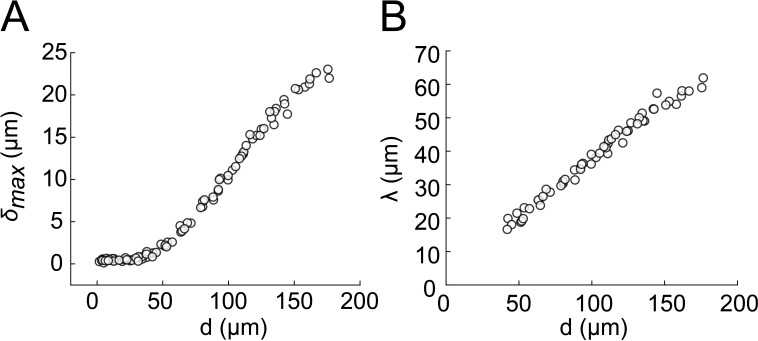
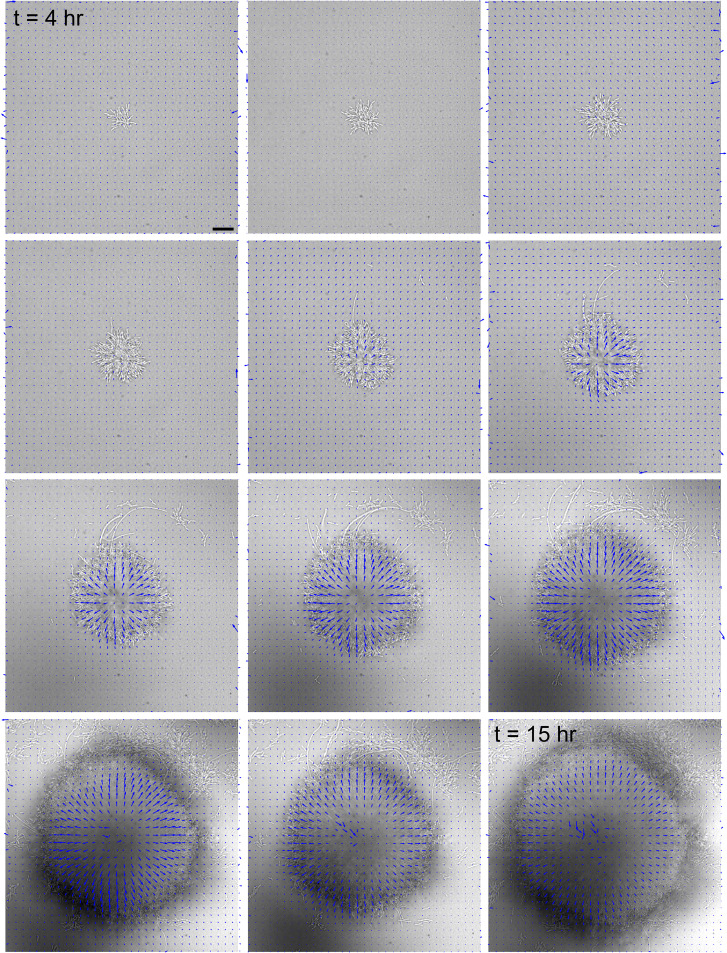
(A) Morphological parameters (maximum deformation amplitude) and (half max full width) computed from resliced deformation profiles. Dashed line indicates the baseline position of the gel surface. (B) Timelapse visualization of V. cholerae Rg biofilm growth (brightfield, top) with deformation (reslice, bottom). Dashed lines indicate biofilm position and size on the corresponding hydrogel profile. (C) Superimposition of these profiles shows the rapid deformation and the emergence of a recess at biofilm edges. Each color corresponds to the same biofilm at different times. (D) Time evolution of shows a rapid increase after 6 to 7 hr of growth. (E) The dependence of on biofilm diameter highlights a critical biofilm diameter dc above which deformation occurs. For D and E, each line color corresponds to a different biofilm. (F) Hydrogel strain field computed by digital volume correlation between 11 hr and 12 hr of growth. We superimposed the vector strain field with a brightfield image of the biofilm. For visualization purposes we only display data for the top right quarter of the biofilm shown in inset (dashed lines). E = 38 kPa. Scale bar: 10 µm for inset t = 0 hr in (B), else 20 µm.


