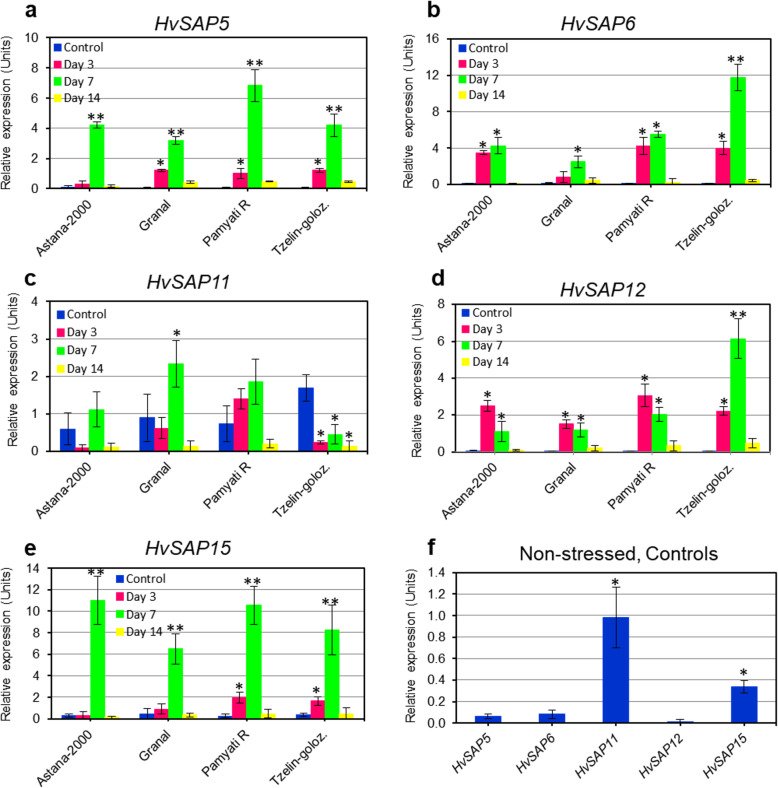
Fig. 4.
Expression analysis of five selected HvSAP genes. a HvSAP5; b HvSAP6; c HvSAP11; d HvSAP12; e HvSAP15, in leaves of four barley cultivars grown in hydroponics with 150 mM NaCl solution for 0 (Control), 3, 7 and 14 days. f Averaged expression of the five selected genes in Control plants of four studied barley accessions for comparison. Expression data were normalised using the averages of two reference genes, HvADP and HvGAPDH, and presented as the average ± SE of three biological and two technical replicates for each genotype and treatment. Significant differences are indicated by asterisks compared to Controls within each experiment, and for each barley accession (a-e) and among studied genes (f): * P > 0.95; ** P > 0.99, calculated using ANOVA

