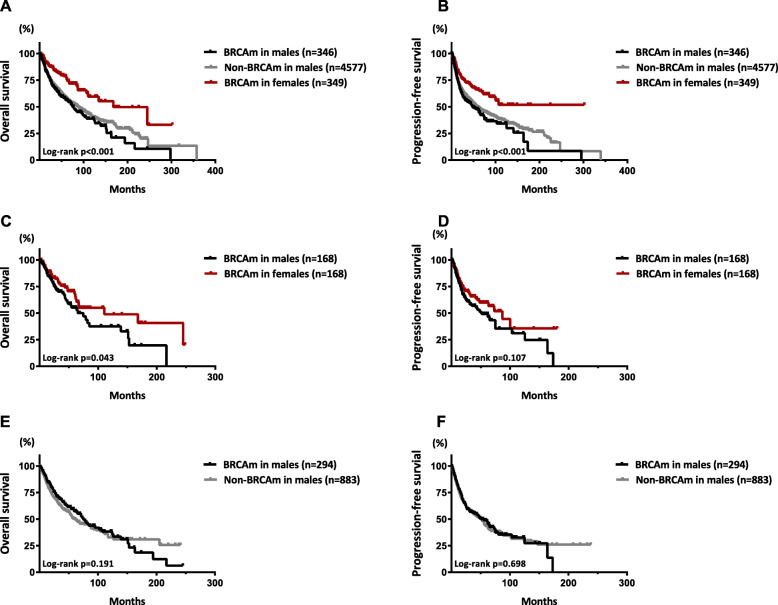
Fig. 3.
Survival curves of overall survival and progression-free survival in male patients with BRCA-associated tumors. Kaplan-Meier curves of OS (a) and PFS (b) among male and female patients with BRCAm as well as non-BRCAm male carriers in the unmatched cohort. Kaplan-Meier curves of OS (c) and PFS (d) between male and female patients with BRCAm in a 1:1 matched cohort. Kaplan-Meier curves of OS (c) and PFS (d) between male patients with and without BRCAm in a 1:3 matched cohort. Propensity score matching for age and TNM stage with a caliper of 0.01 was performed to establish the matched cohorts

