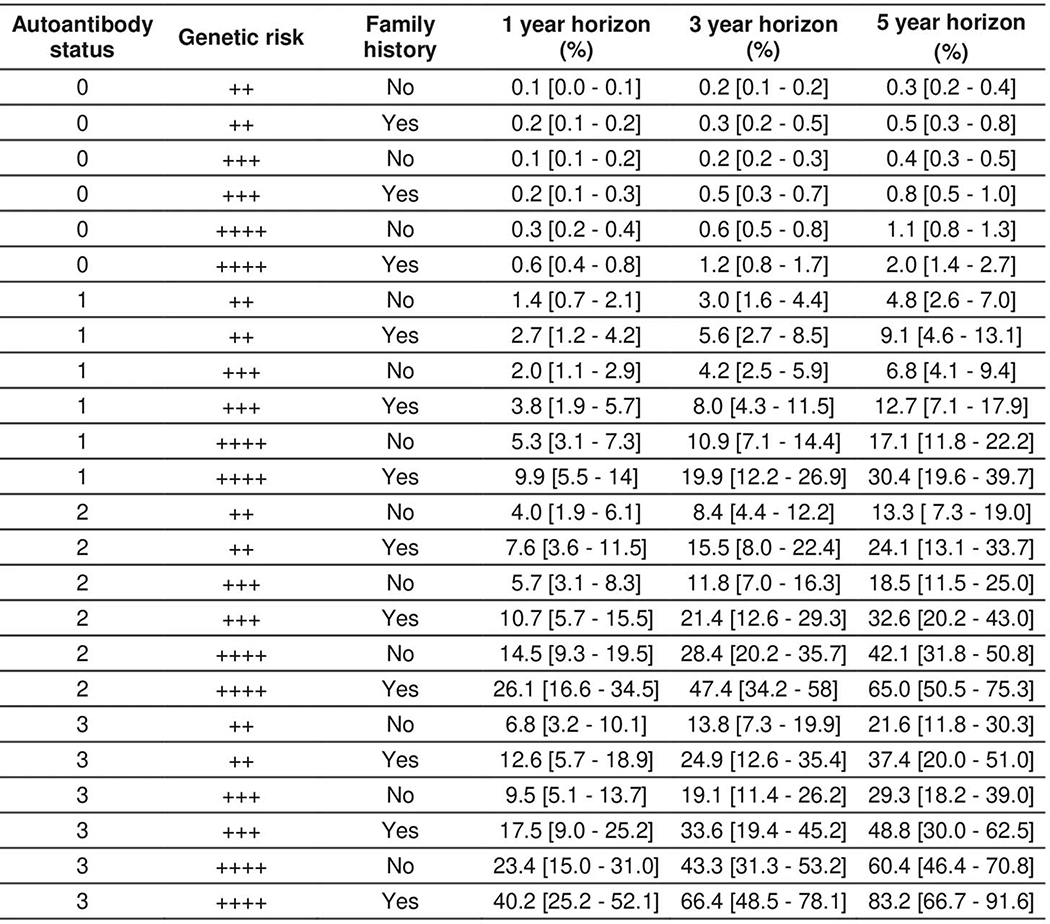
Extended Data Fig. 7. Individual estimated future T1D risk probability percentages (and 95% confidence intervals) for 24 different scenarios combining a GRS risk level and FH background with different AB status calculated at age 2 years.
“++” represents a T1D genetic risk score at 80th percentile of the general (UK) population. “+++” represents a T1D genetic risk score at 90th percentile of the general (UK) population. “++++” represents a T1D genetic risk score at 99th percentile of the general (UK) population.

