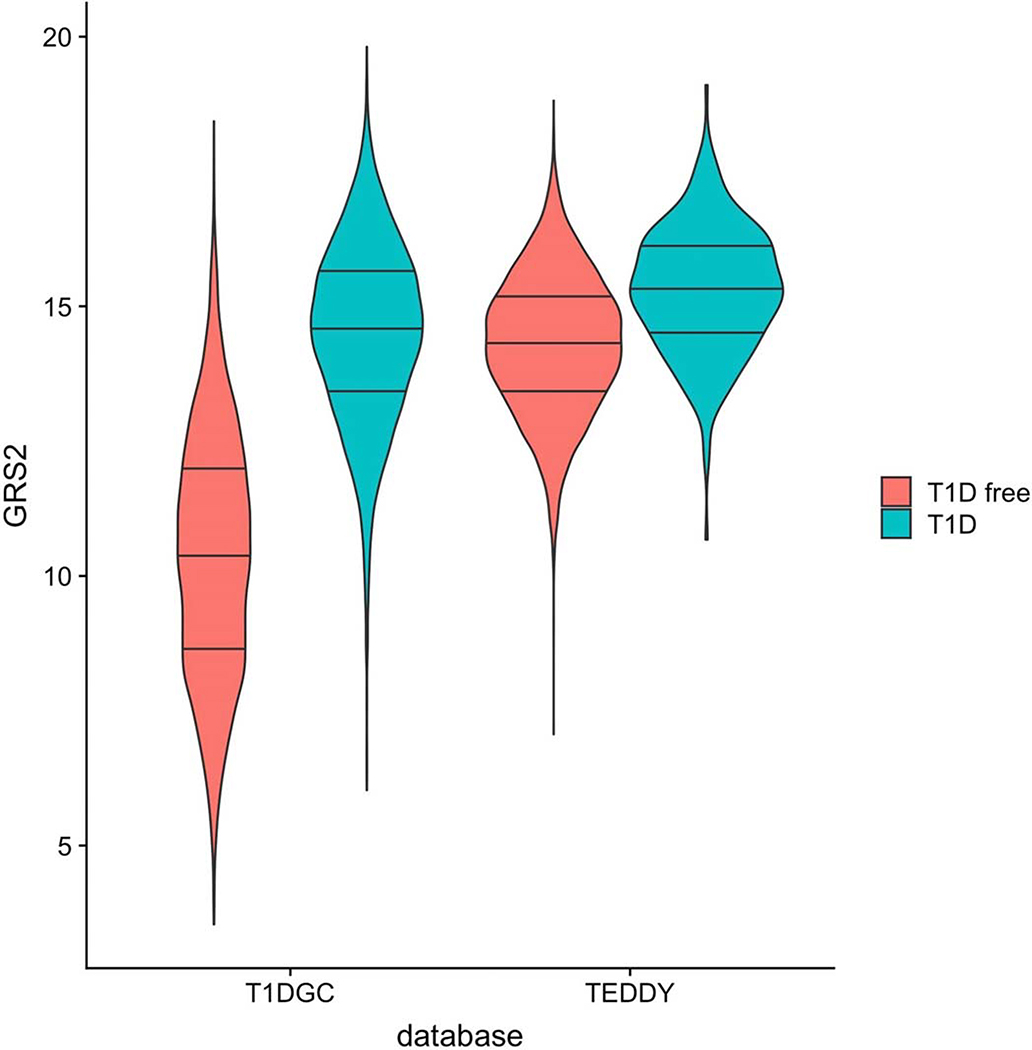
Extended Data Fig. 10. GRS2 violin plot in the Type 1 Diabetes Genetics Consortium (T1DGC) and TEDDY datasets.
T1DGC is more representative of the general background population. The genetic pre- selection in TEDDY based on the major T1D risk locus HLA-DR-DQ, renders the T1D GRS2 higher in TEDDY, even in T1D free subjects. Further, the separation between T1D and non-T1D subjects in TEDDY is much less. There are 7,798 observations in TEDDY including 305 with T1D. There are 15729 observations in T1DGC including 6483 with T1D. The lines in the violin plots respectively indicate the 25th, 50th and 75th percentiles, while the lowest and the highest point of each violin plot indicates the minimum and the maximum, respectively, for each group of individuals.

