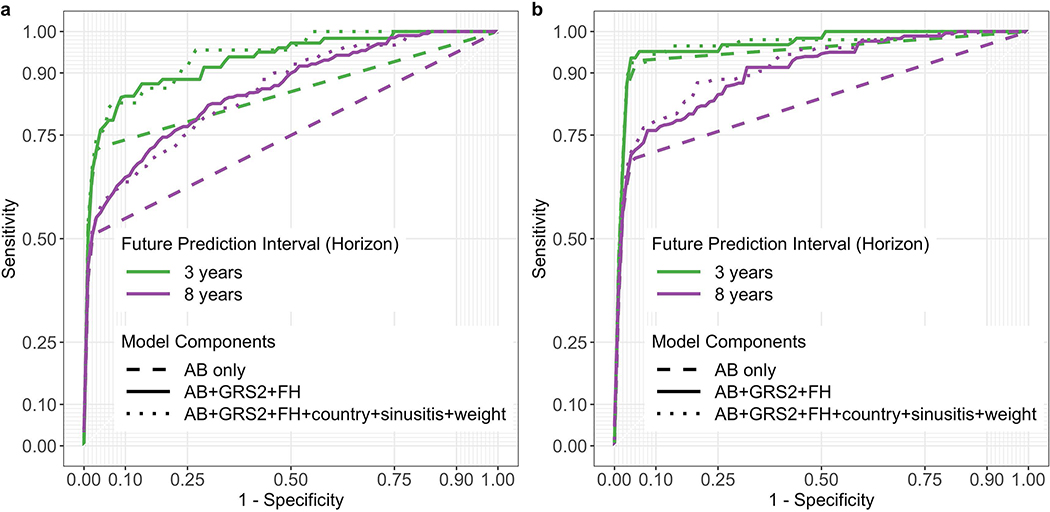
Figure 2:
ROC curves derived from models incorporating different numbers of variables. Use of all 6-variables is denoted by the dotted line, 3-variables by the solid line, and autoantibodies only by the dashed line. Curves in panel a use a landmark age of 2 years, with prediction horizons of 3 or 8 years as indicated. Curves in panel b use a landmark age of 4 years, also with prediction horizons of 3 or 8 years as indicated.

