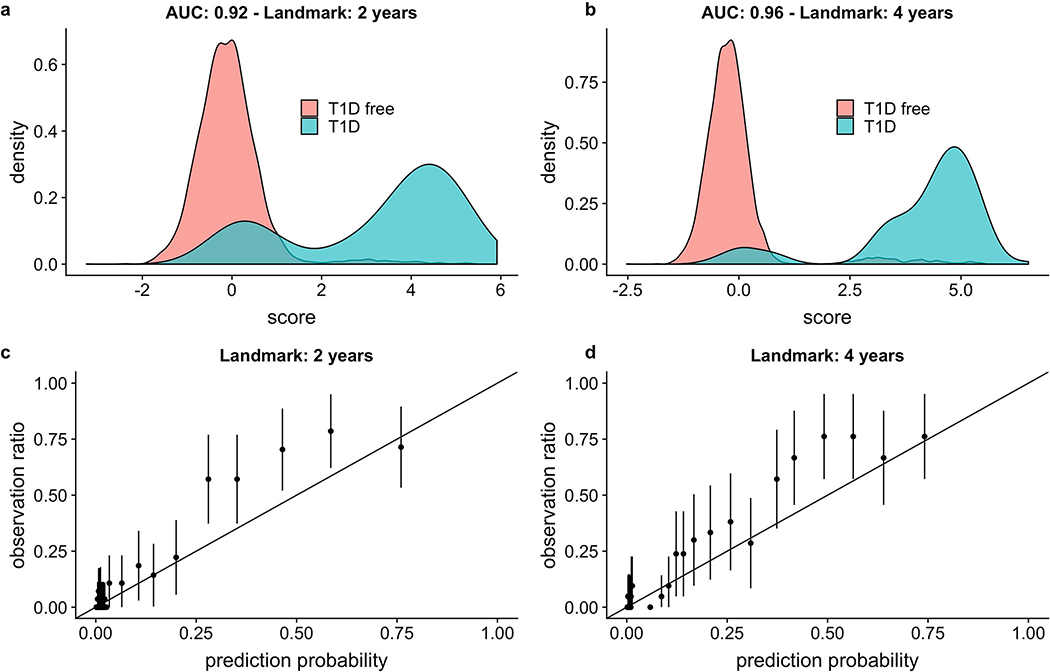
Figure 3:
Performance of the 3-variable model at a 5-year horizon. Panels a and b: Score distributions using a 2-year or 4-year landmark age, respectively. AUC ROC values are noted on the figure. The T1D CRS was generated by the linear predictor of the parametric part of the hazard function of the Cox model. Panels c and d: Calibration plots using a 2- year or 4-year landmark age, respectively. The predictions are grouped into bins corresponding to centiles, and then each bin prevalence (the ratio of plots in this bin with observed T1D endpoints to the total number of plots in this bin) is calculated. Each point represents the mean of each bin, and each error bar indicates the 95% confidence interval of that mean (computed by assuming using normal approximation interval). For 2-year or 4-year landmark ages, a total of n= 6,805 and n= 5,973 children with an AB test in the prior 6 months were analyzed, respectively.

