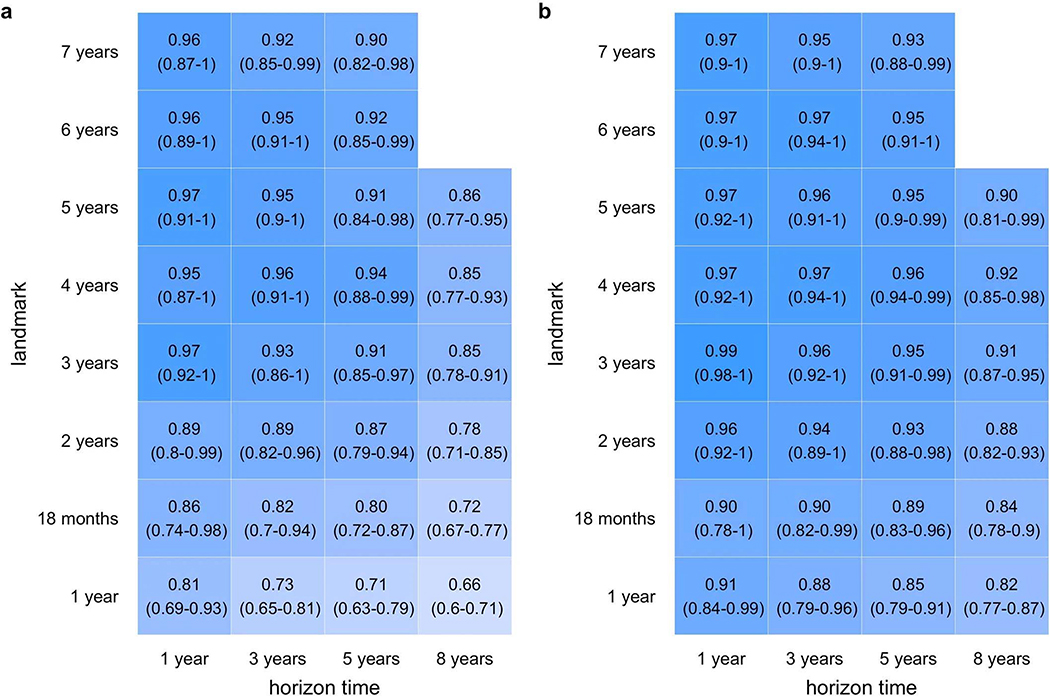
Extended Data Fig. 4. T1D GRS2 and family history add predictive power to AB.
AB alone (a) is compared to the three-variable model of AB, GRS2 and FH. (b) at eight different landmark scoring ages and over four different horizon times. Although 95% confidence intervals overlapped, among 30 total combinations, the three-variable model yielded larger AUC ROC in 28 of these combinations and similar results in the remaining 2 combinations. The differences were often substantial, especially at landmarks ≤4 years of age. The number of children at each landmark age were 7798 (birth), 7563 (1 year), 7123 (1.5 years), 6805 (2 years), 6316 (3 years), 5973 (4 years), 5706 (5 years), 5517 (6 years) and 5323 (7 years).

