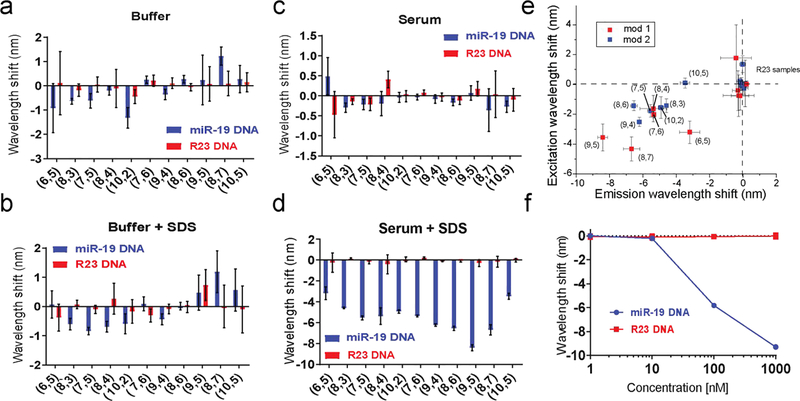
Figure 1:
Modulation of the GT15miR19 nanotube sensor response to nucleic acids. a. Wavelength shifting response of the GT15miR19 nanotube sensor after overnight incubation with 1 μM target miR-19 DNA (orange) or control R23 DNA (purple) for the indicated nanotube chiralities in buffer. b. Wavelength shift after overnight incubation with 1 μM target miR-19 DNA (orange) or control R23 DNA (purple) for the indicated nanotube chiralities in 1% SDS. c. Wavelength shift of the GT15miR19 nanotube sensor after overnight incubation with 1 μM target miR-19 DNA (orange) or control R23 DNA (purple) for the indicated nanotube chiralities in fetal bovine serum (FBS). d. Wavelength shift after overnight incubation with 1 μM miR-19 target DNA (orange) or control R23 DNA (purple) for the indicated nanotube chiralities in FBS treated with 1% SDS. e. Plots of excitation and emission wavelength shift in response to target miR-19 DNA and control R23 DNA in serum treated with 1% SDS. Nanotubes treated with target DNA are labeled by chirality, while the labels for nanotubes treated with R23 control DNA labels were omitted for clarity. Colors indicate mod type of the nanotube. Error bars represent standard deviation of technical triplicates. f. Wavelength shift of GT15miR19 nanotube sensor after overnight incubation with indicated concentrations of target miR-19 DNA (orange) or control R23 DNA (purple) in FBS treated with 1% SDS. Error bars represent standard deviation of technical replicates.

