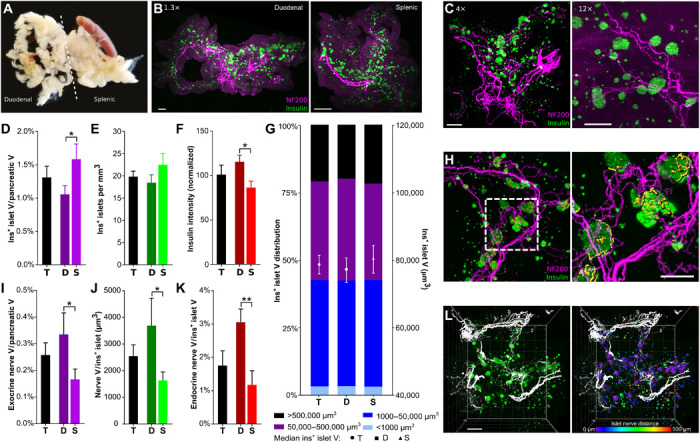
Fig. 1. β cell distribution and pancreatic innervation in C57BL/6 mice.

(A) Pancreatic dissection. Photo credit: A.A., Icahn School of Medicine at Mount Sinai. (B) Duodenal (left) and splenic (right) pancreas, maximum projection (1.3×). Scale bars, 500 μm. (C) Pancreata, maximum projection at 4× (left) and 12× (right). Scale bars, 500 and 200 μm. (D) β cell volume. (E) Insulin+ islets per cubic millimeter. (F) Insulin intensity (normalized to whole pancreas). (G) Insulin+ islet volume distribution (left axis) and median volume (right axis). Islets per group: 27,092/12,260/14,832. (H) 3D projection of insulin, NF200+ exocrine innervation, and NF200+ surfaces within insulin+ islets (yellow). (I) Exocrine nerve volume. (J) Endocrine nerve volume per insulin+ islet. (K) Endocrine nerve volume/islet volume. (L) Left: 3D model of pancreatic innervation (NF200, white) and insulin (green). Right: Distance transformation analysis with islet surfaces pseudocolored based on distance from the nearest nerve surface. Scale bar, 500 μm. Boxed area magnified in the right panel. Scale bar, 200 μm. Data are shown as means ± SEM or median ± 95% confidence interval as indicated. Analyses by unpaired t test, *P < 0.05 and **P < 0.01. T, total; D, duodenal; S, splenic. N = 7 (D to G) and N = 5 (I to K).
