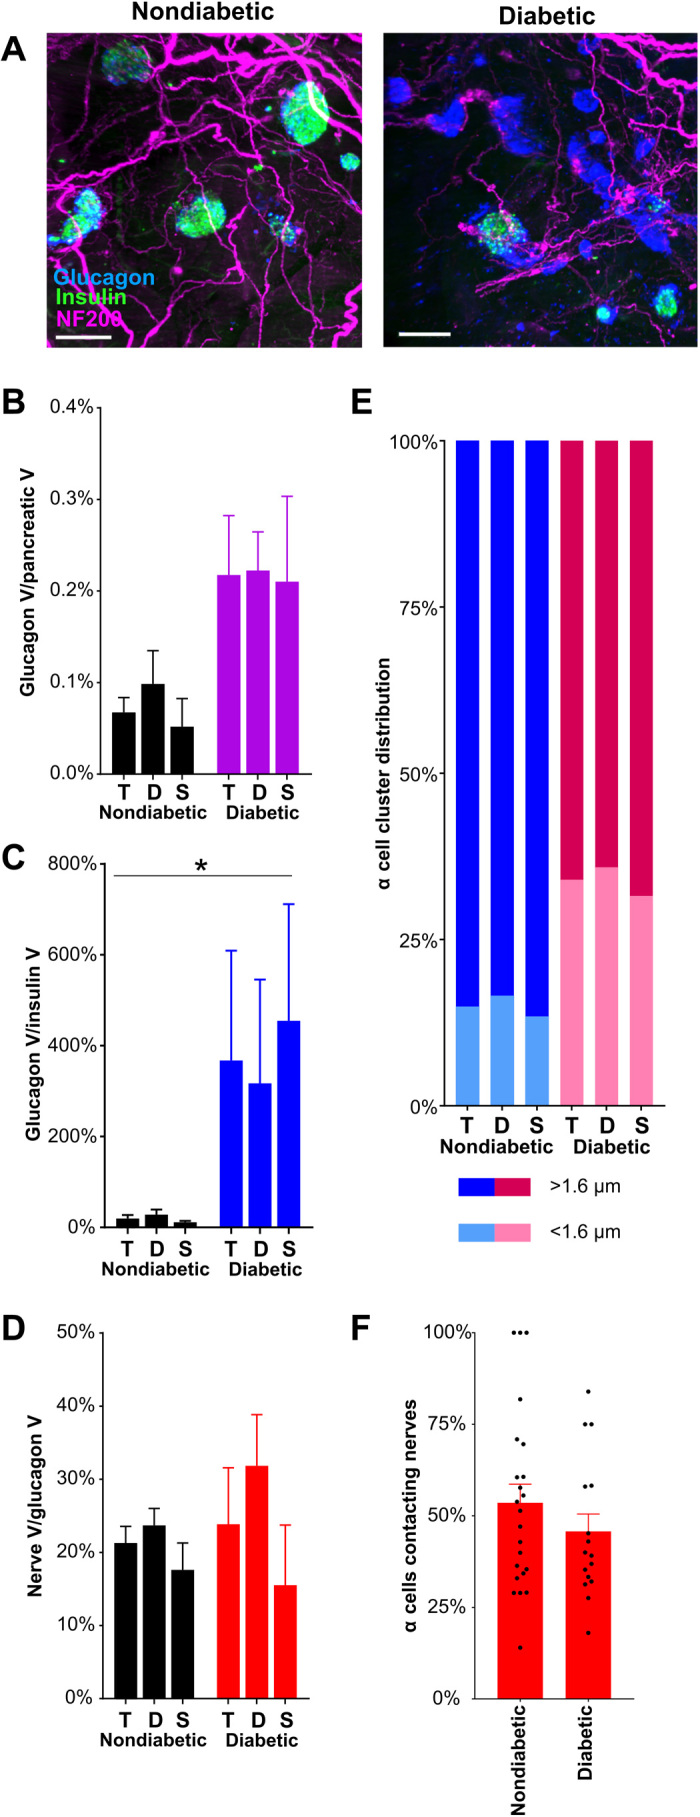
Fig. 4. α cell distribution and innervation in nondiabetic and diabetic NOD mice.

(A) Maximum projections of light-sheet images of pancreatic samples from nondiabetic and diabetic NOD mice stained for insulin (green), NF200 (magenta), and glucagon (blue) and imaged at ×4 magnification. Scale bars, 200 μm. (B) α cell volume corrected for pancreatic volume in NOD mice. (C) Glucagon+ α cell volume as a percentage of insulin+ β cell volume in NOD mice. (D) NF200+ nerve volume within glucagon+ α cell clusters in NOD mice. (E) Glucagon+ α cell cluster volume (left axis) and median nerve distance (right axis) in NOD mice. (F) Percentage of α cells contacting nerves per islet. Number of islets: 23/16. Data are shown as mean ± SEM or as median ± 95% confidence interval where indicated. Analyses by one-way ANOVA with Tukey’s test (D) or Kruskal-Wallis with Dunn’s test (B, C, and E). *P < 0.05. T, total; D, duodenal; S, splenic. N = 3 nondiabetic and N = 3 diabetic NOD mice.
