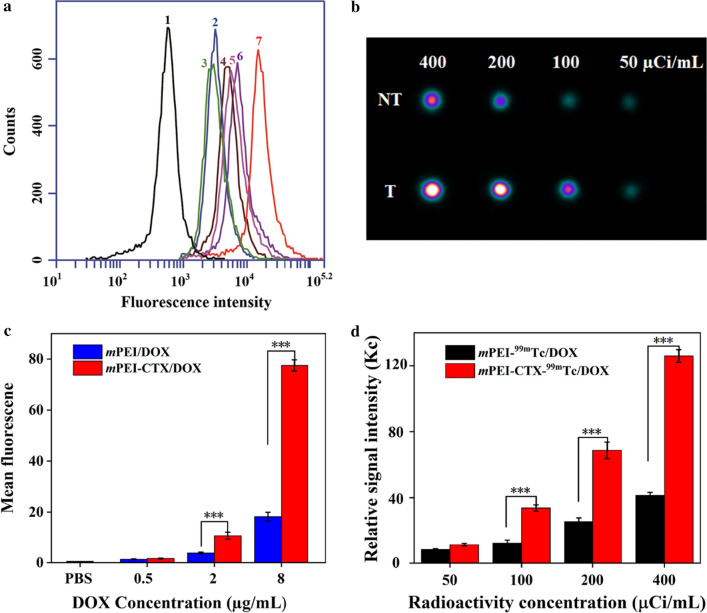
Fig. 5.
a The comparison and b flow cytometric analysis of C6 cells treated with mPEI-CTX/DOX and mPEI/DOX at different DOX concentrations for 4 h. Concentrations were (1) PBS, (2) 0.5 μg/mL mPEI/DOX, (3) 0.5 μg/mL mPEI-CTX/DOX, (4) 2 μg/mL mPEI/DOX, (5) 2 μg/mL mPEI-CTX/DOX, (6) 8 μg/mL mPEI/DOX, and (7) 8 μg/mL mPEI-CTX/DOX. (c) In vitro SPECT images of C6 cells treated with mPEI-CTX-99mTc /DOX (T) and mPEI-99mTc/DOX (NT) for 4 h at the radioactivity concentrations of 50, 100, 200, and 400 μCi/mL, and d their relative SPECT signal intensities

