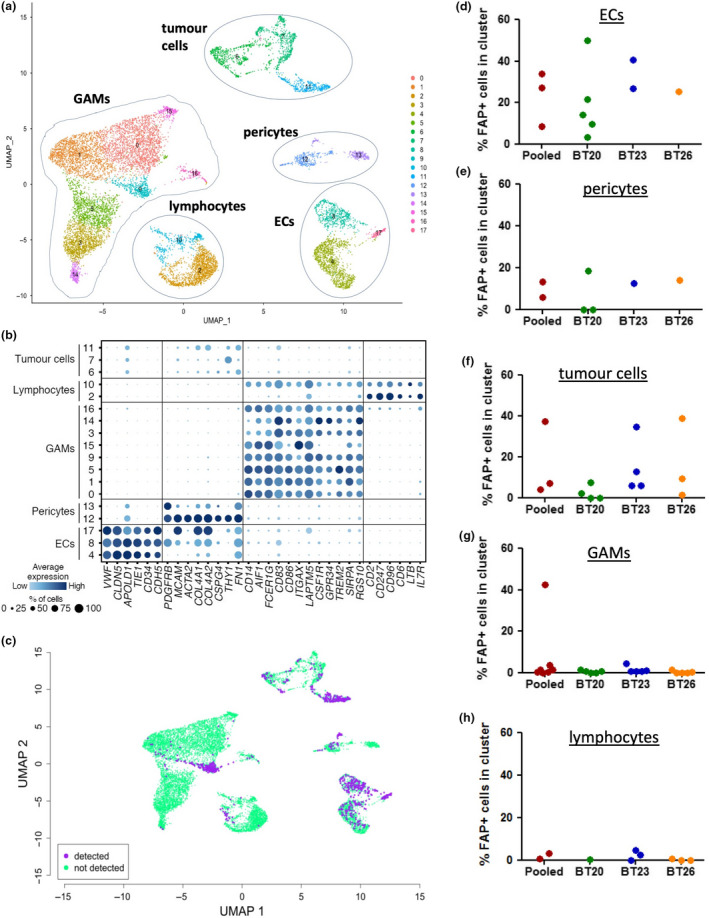
Figure 5.

Single‐cell transcriptomic analysis of glioblastoma tissue specimens. Fresh tumor tissue specimens from three patients were dissociated to single‐cell suspensions and analysed by scRNAseq. ( a–c ) Results for the three patients pooled into a single dataset. (d–h) Summary graphs of the results for the pooled dataset and each individual specimen, as indicated. (a) UMAP plot showing unsupervised clustering of cells, with the cell type of each cluster annotated according to the presence of marker genes. (b) Dot plot showing the expression of marker genes used to define the indicated cell types within each numbered cluster. Size and colour intensity of dots indicates the percentage of cells in the cluster expressing the gene and the average level of expression, respectively. (c) The UMAP plot was coloured according to whether FAP transcripts were expressed (purple) or not (green) in individual cells. (d–h) Summary graphs showing the percentage of cells within indicated cluster types expressing detectable FAP. Each dot represents an individual cluster within the indicated dataset.
