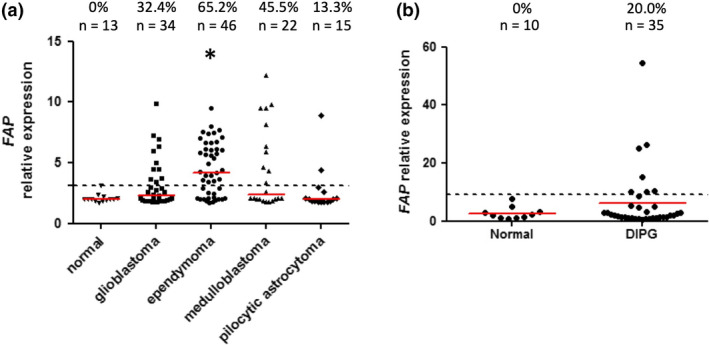
Figure 7.

Transcriptomic analysis of FAP expression in paediatric brain tumors. FAP gene expression values were extracted from microarray dataset GSE50161 (a) or GSE50021 (b). The relative expression value for each tissue sample is shown. Red lines represent the median of each group, while dotted lines represent the threshold for FAP expression, based on [mean + (3 x SD)] of the normal brain dataset. The total number of samples in each group, and the proportion with expression above the threshold, is indicated at the top of the graphs. (a) All groups were compared using the Kruskal–Wallis test (P < 0.005); pairwise comparisons significant by Dunn’s post‐test compared to normal brain are indicated by asterisks. (b) Comparison of DIPG vs normal using the Mann–Whitney U‐test was not significant.
