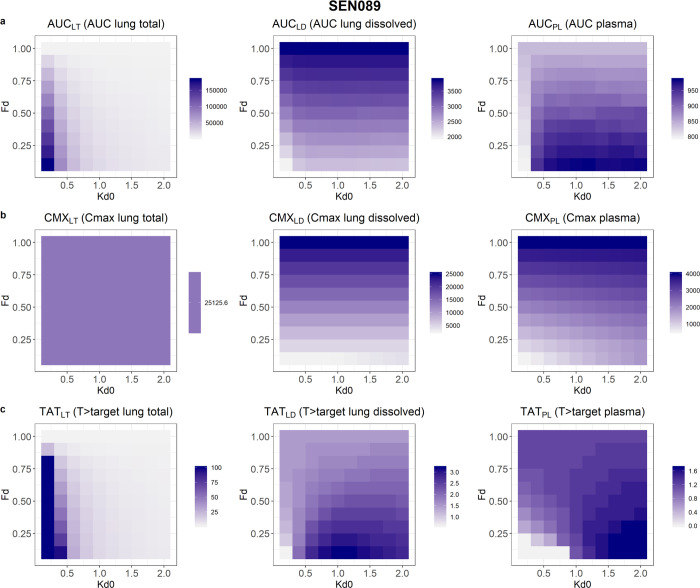
Figure 6.
The predicted (a) area-under-the-curve at 24 h (AUC), (b) maximum concentration (Cmax), and (c) fraction of time above the target concentration (% T > target) over a 24 h period of SEN089 in lungs and plasma resulting from a range of initial fractions dissolved (Fd) and baseline dissolution rate constants (kd0). The shade of the color represents the values in the formulation design space explored where dark purple is highest and white is lowest.

