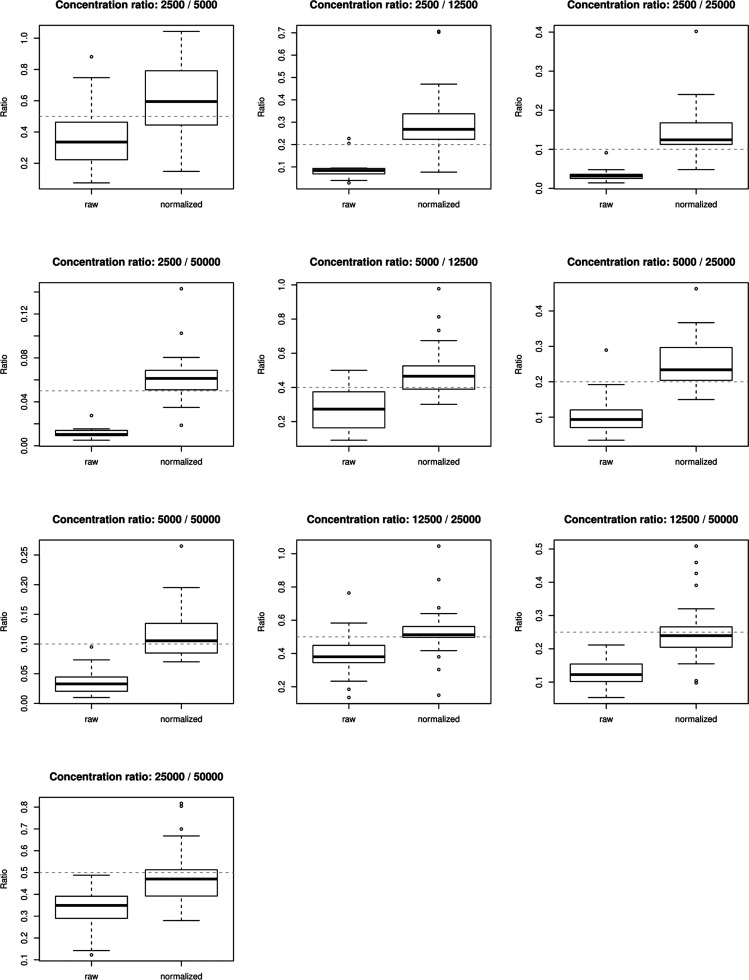
Figure 3.
Distribution ratios of spiked-in proteins (averages across replicates) of different spike-in concentrations for raw and normalized protein intensities. Intensities of spiked-in proteins were averaged across concentration replicates to calculate the ratio of averaged proteins between different spike-in concentrations. The distributions of ratios of the measured proteins are compared between raw and normalized protein data. Spiked-in concentrations of 50–500amol were excluded due to the absence of most measurements.

