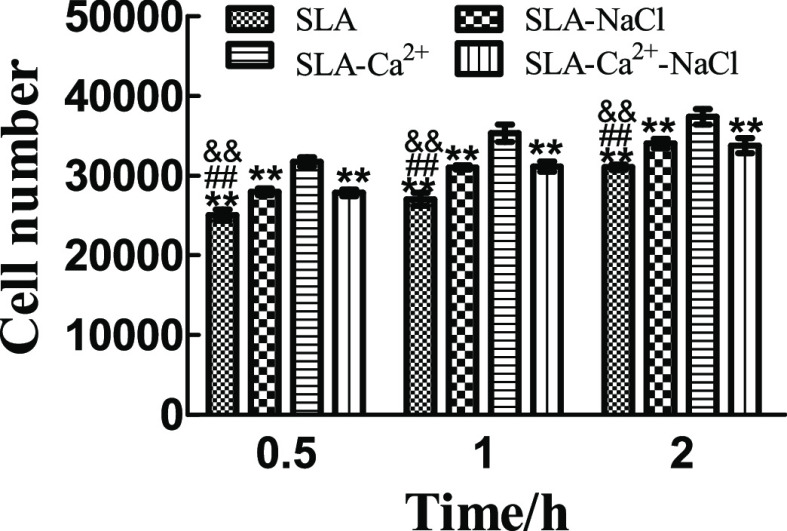
Figure 8.
Cell numbers (mean ± standard deviation) on different surfaces at different times (n = 3, 10 different random fields of each disc). The number of adherent cells on the SLA-Ca2+ surfaces was significantly higher than that on the other three surfaces (P < 0.01). The cell number on the surface of the SLA-NaCl and SLA-Ca2+-NaCl groups was significantly higher than that in the SLA group (P < 0.01), but the two groups have no difference at each time point. The surfaces of the SLA group had the lowest number of cells among the groups at each incubation time point. **P < 0.01 compared to the group of SLA-Ca2+, ##P < 0.01 compared to the group of SLA-NaCl, and &&P < 0.01 compared to the group of SLA-Ca2+-NaCl.

