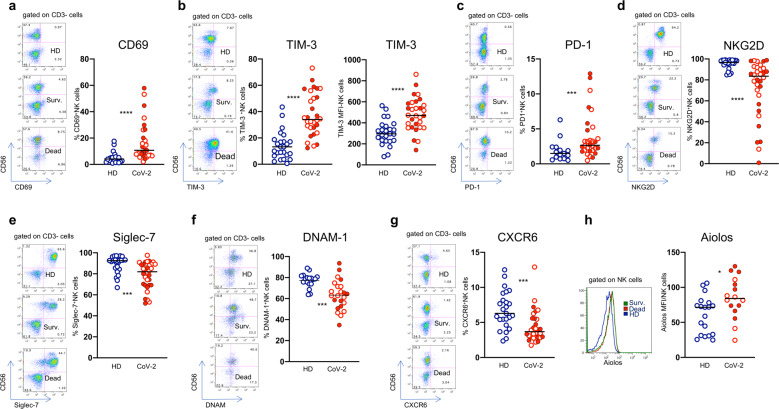
Fig. 2.
NK cells show an exhausted phenotype in patients with COVID-19. Frequencies of (a) CD69- and (b) TIM-3-expressing NK cells in healthy donors (HD) and patients with COVID-19 (CoV-2) and corresponding representative dot plots. c Levels of expressions of TIM-3 checkpoint molecule on NK cells. Proportion of (d) PD-1-, (e) NKG2D-, (f) Siglec-7-, (g) DNAM-1-, and (h) CXCR6- positive NK cells and corresponding representative dot plots. i Intracellular Aiolos expression in NK cells, expressed as Mean Fluorescence Intensity (MFI). Representative histogram of Aiolos expression on NK cells from a HD (blu line), Survived (green line) and Dead patients (red line). Middle bars represent medians. Full red symbols indicate deceased patients. The Mann–Whitney U test was used to compare the two groups. *p < 0.05, ***p < 0.001, ****p < 0.0001

