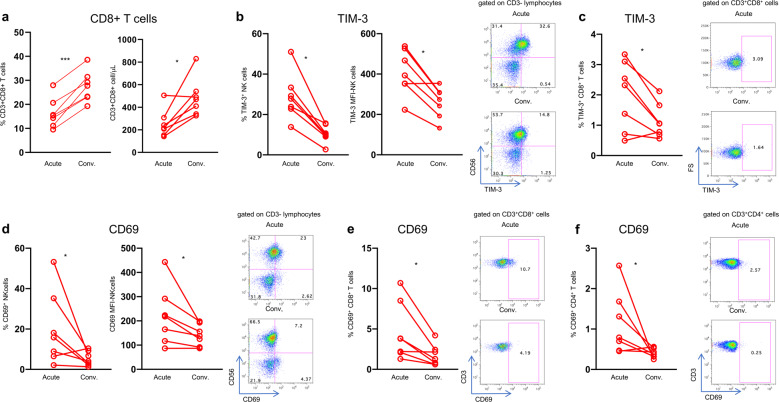
Fig. 5.
Recovery of CD8 T cells and immune reconstitution in convalescing patients. a Frequency and absolute numbers of peripheral blood circulating CD8 + T cells in COVID-19 patients during the acute and convalescent (Conv.) phases. b Perecentages (left) and levels of expression (MFI, middle) of TIM-3 molecule by NK cells. Representative dot plots are shown (right). c Proportions of TIM-3 positive CD8 + T cells and representative dot plots. d Frequency of CD69-expressing NK cells (left) and MFI of the early activation marker CD69 on NK cells (middle). Representative dot plots are shown (right). e, f Frequency of CD69-expressing CD8 and CD4 T cells and corresponding representative dot plots. Paired data were analyzed by the Wilcoxon signed rank test. *p < 0.05, **p < 0.01, ***p < 0.001

