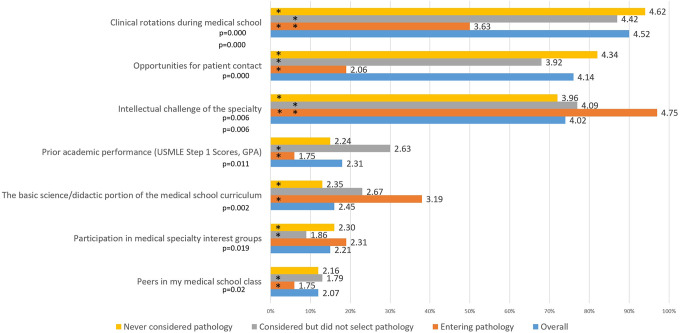
Figure 4.
Factors impacting specialty choice: Statistically significant differences between respondent groups. Significance was tested via 1-way analysis of variance. *The groups demonstrating significant differences in responses for each factor. The numbers labeling each bar indicate the mean rating across all respondents. The percentage on the x-axis designates the percent responding very much so (5) or for the most part (4).

