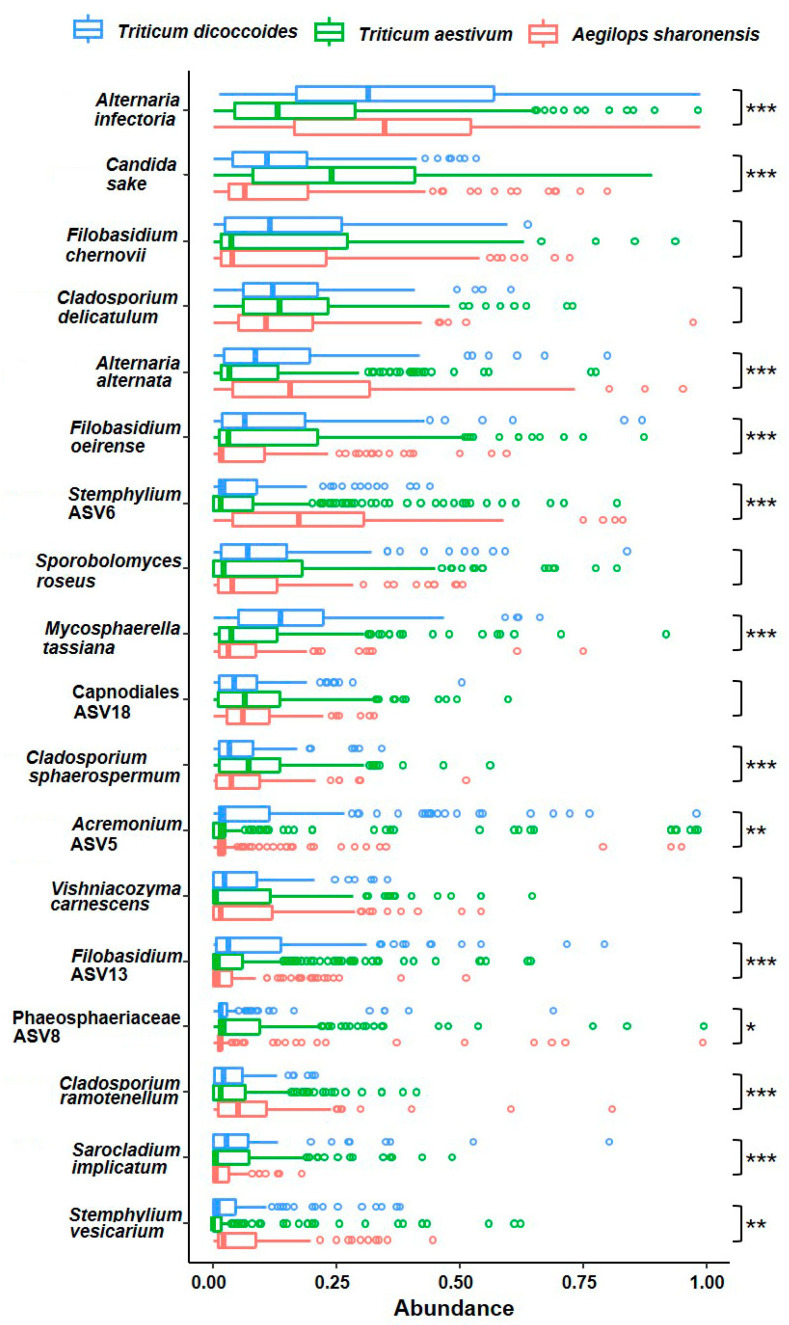
Figure 4.
Abundance of the most dominant fungal taxa in each of the three plant species. The top 18 most abundant endophytic taxa accounted for 50% of total abundance in the core dataset. The Hellinger transformed abundance of each taxon is shown for each of the three host plants. Outliers are plotted with open cycles. One-way ANOVA was used to test the significance of abundance difference among hosts (p < 0.001, ***; p < 0.01, **; p < 0.05, *).

