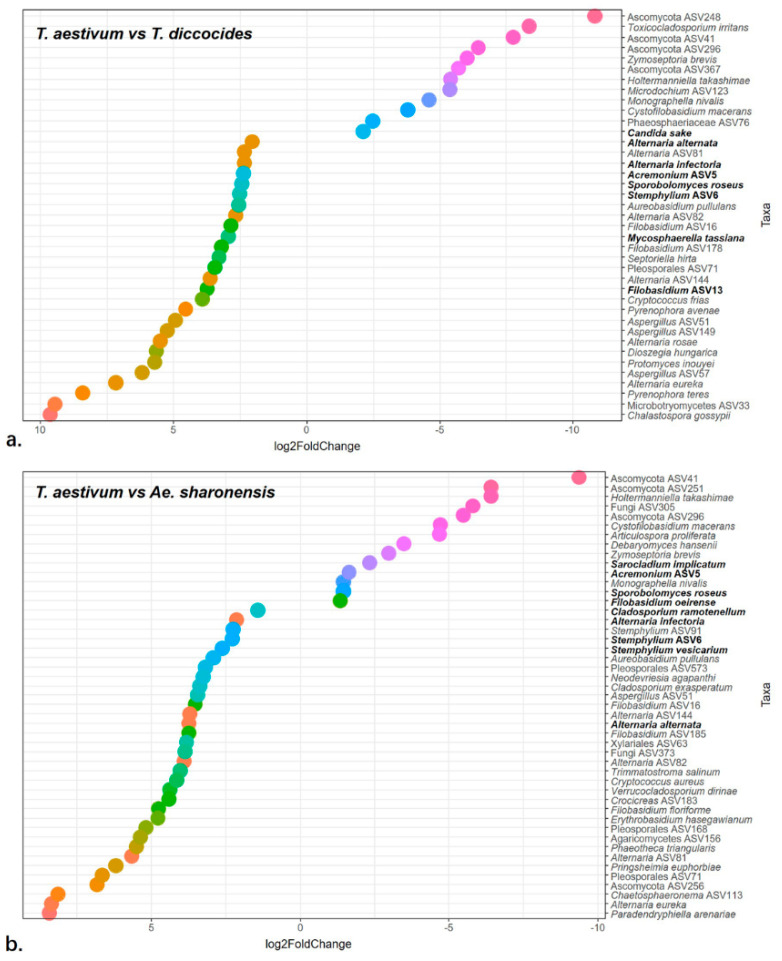
Figure 8.
Differentially enriched fungal taxa. Differentially enriched taxa were identified using DeSEQ2 analysis. The graphs show a pair-wise comparison of fungal taxa that are differentially enriched at log2 fold or higher. Fungal taxa are shown on the Y-axis, and the dots represent significantly higher (Log2Fold > 0) and lower (Log2Fold < 0) abundances in wheat compared with either TD (a) or AS (b). Highly abundant taxa (see Figure 4) are in bold letters. Fungal genera are color coded.

