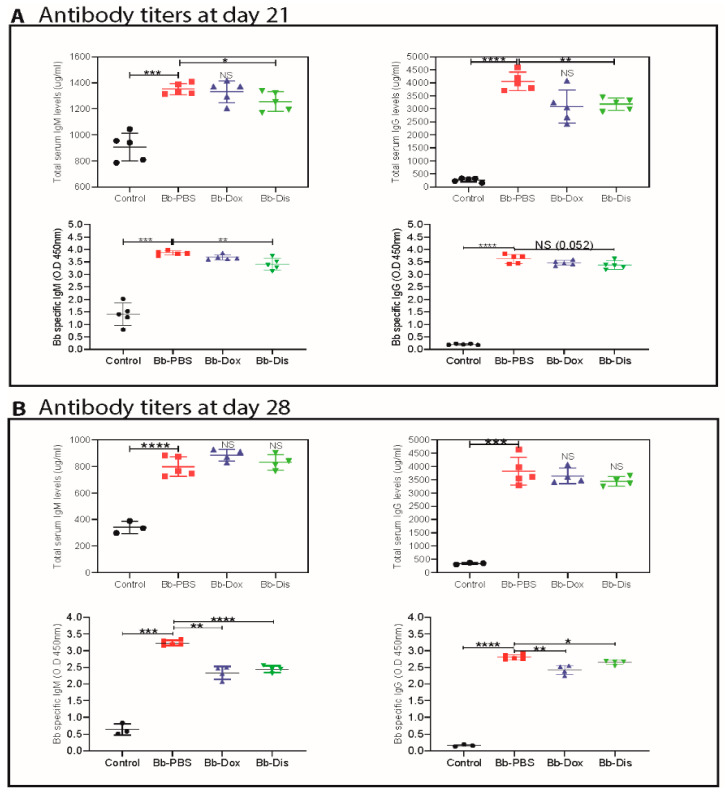
Figure 5.
Antibody response in the serum with and without antibiotics treatment which were quantified by ELISA. Total and Bb specific concentration of IgM, IgG, antibodies (A) day 21 post- and (B) day 28 post-infection. Statistics: unpaired t-test with Welch’s correction between controls versus infected and between drug-treated group versus infected group. * p < 0.05, ** p < 0.01, *** p < 0.001, **** p < 0.0001. NS means not significant.

