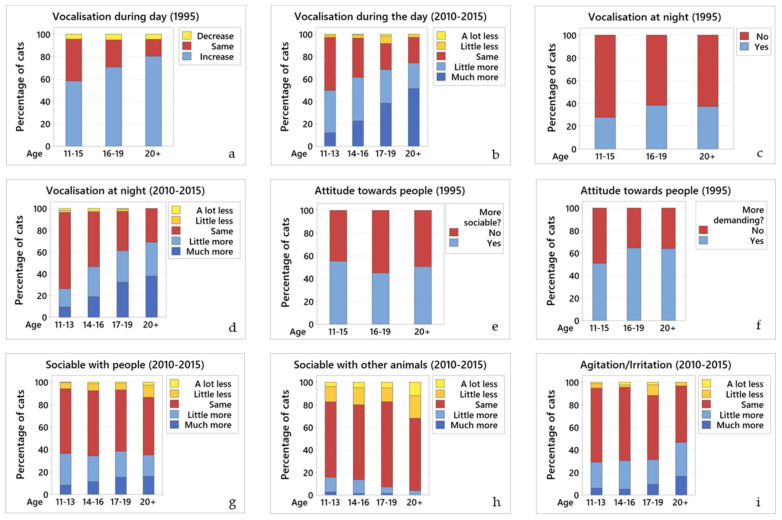
Figure 1.
Changes in the different behaviours across age groups. Comparative graphs showing changes in behaviour across age groups for (a) vocalisation during the day (1995); (b) vocalisation during the day (2010–2015); (c) vocalisation at night (1995); (d) vocalisation at night (2010–2015); (e) attitude towards people—more sociable (1995); (f) attitude towards people—more demanding (1995); (g) sociability with people (2010–2015); (h) sociability with other animals (2010–2015); and (i) agitation/irritation (2010–2015). In all graphs of this panel, blue colours represent an increase in the particular behaviour, yellow represent a decrease, and red represent no change.

