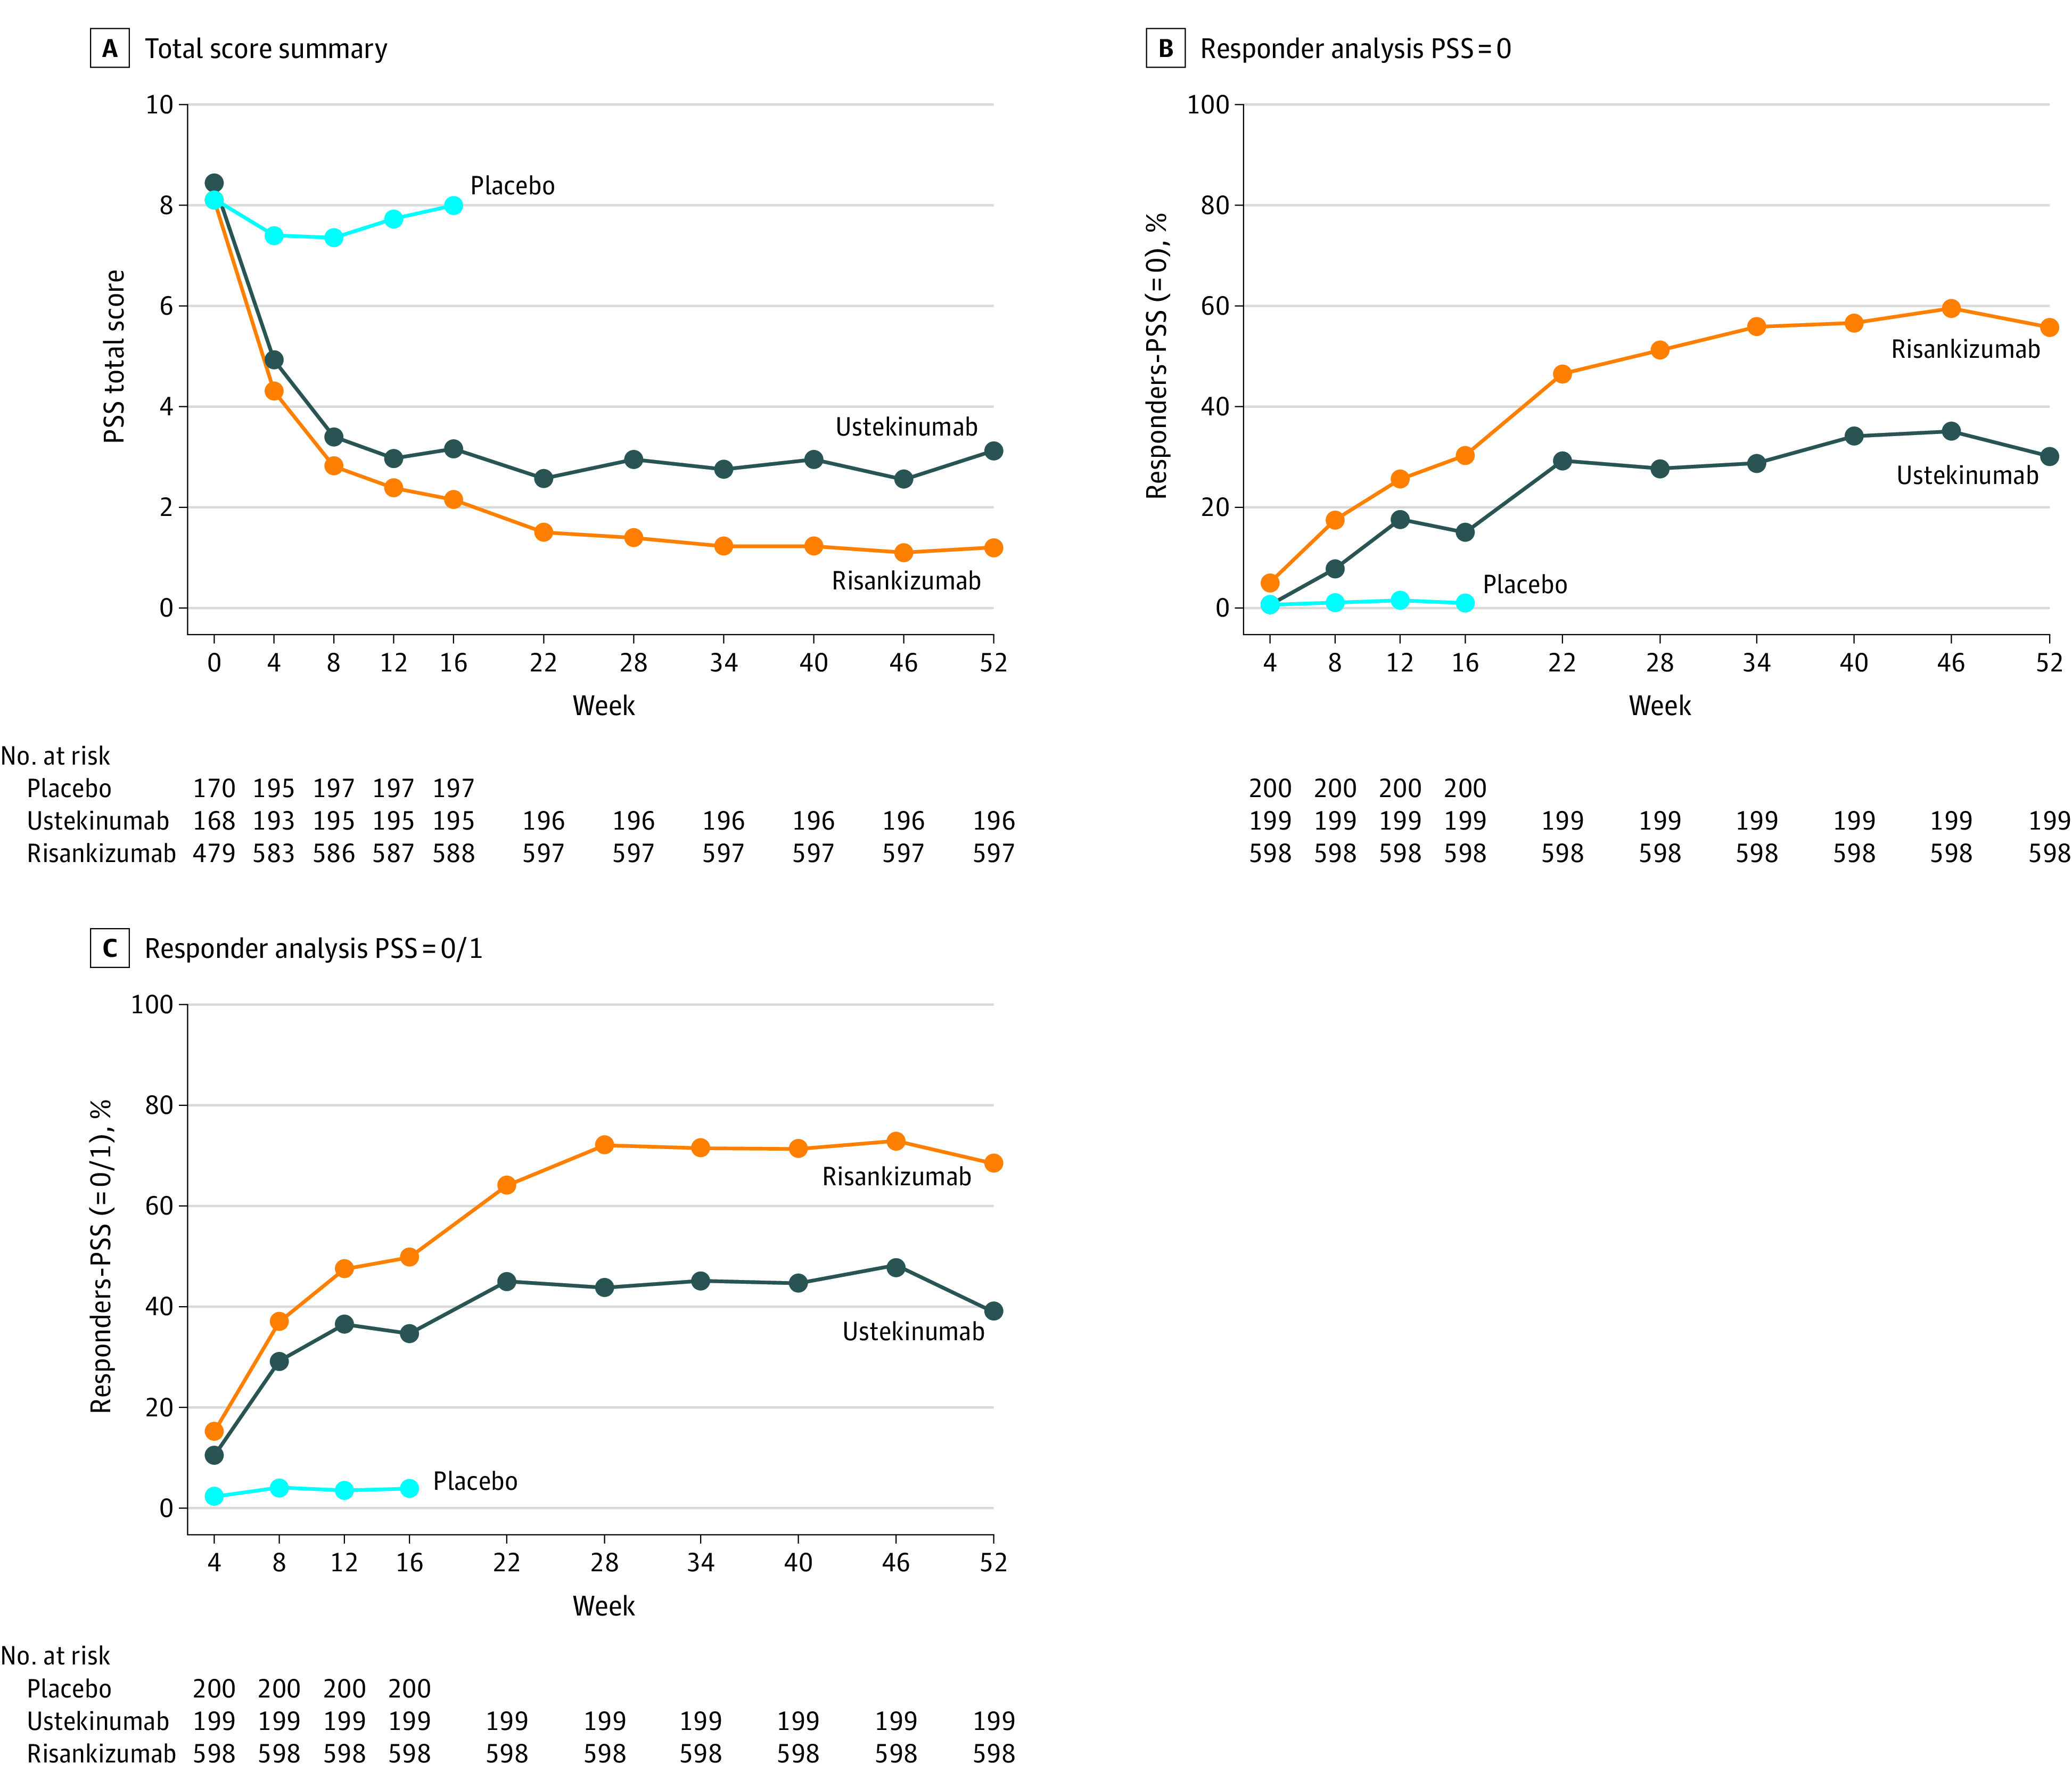
Figure 1. Total Psoriasis Symptom Scale (PSS) Score Analyses.

A, PSS Total score summary.Mean values are shown. The PSS total scores were exploratory outcomes in the trials. The last observation carried forward imputation was adopted for missing data. Risankizumab-treated patients had significantly lower PSS total scores compared with placebo-treated patients at week 4 through week 16 (P < .001) and ustekinumab-treated patients at week 4 through week 52 (P = .01 at week 4, P = .01 at week 8, P = .008 at week 12, and P < .001 at all other time points). B, PSS = 0 Responder Analysis. The nonresponder imputation (NRI) approach was used. PSS = 0 at week 16 was a ranked secondary outcome; all other time points were exploratory outcomes. A significantly greater proportion of risankizumab-treated patients achieved PSS = 0, compared with patients treated with placebo (P = .008 at week 4, P < .001 at all other time points) and those treated with ustekinumab (P = .02 at week 4, P = .03 at week 12, and P < .001 at all other time points). C, PSS = 0/1 responder analysis. NRI approach was used. PSS = 0/1 was an exploratory outcome. From week 12 through week 52, a significantly greater proportion of risankizumab-treated patients achieved PSS = 0/1 compared with ustekinumab-treated patients (P = .01 at week 12 and P < . 001 at week 16 through week 52).
