
Figure 4.
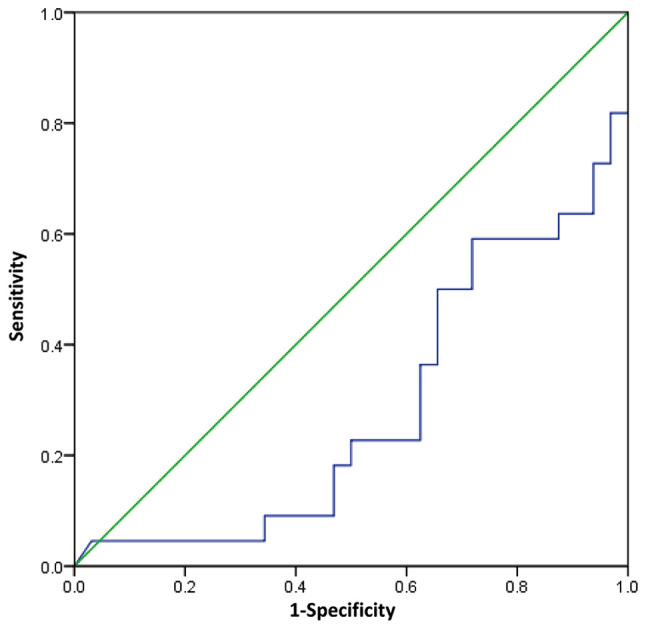
ROC curve of E2 level in follicular fluid and pregnancy outcome. The ROC and area under curve were calculated. The green line represents the reference line. The blue line represents the E2 results. ROC, receiver operating characteristic curve; E2, estradiol.