. 2020 Sep 25;37(3):301–310. doi: 10.5511/plantbiotechnology.20.0421a

Figure 2. HPLC elution profiles of the products of recombinant I3S reactions. Affinity purified PsI3S1 and crude extracts of E. coli expressing I3S proteins of soybean (GmI3S1) and L. japonicus (LjI3S1 and LjI3S2) were reacted with (3R,4R)-DMI (4a), and ethyl acetate extracts of the reaction mixtures were analyzed. Because the maximum absorbances of the substrate (λmax 280 nm, retention time 5.6 min) and product (5a, λmax 340 nm, retention time 13.8 min) are largely different, the substrate was not detected in this chromatogram. The ordinate scales of the HPLC charts are equal. The eluates (retention times 5.0 to 6.0 min) monitored at 280 nm are shown in the dotted line frame, and the ordinate scales represent mAU. UV spectra of the product (5a) by PsI3S1 reaction and the substrate (4a) are shown in the line frame. A crude extract of E. coli transformed with pET-21a was used as the control.
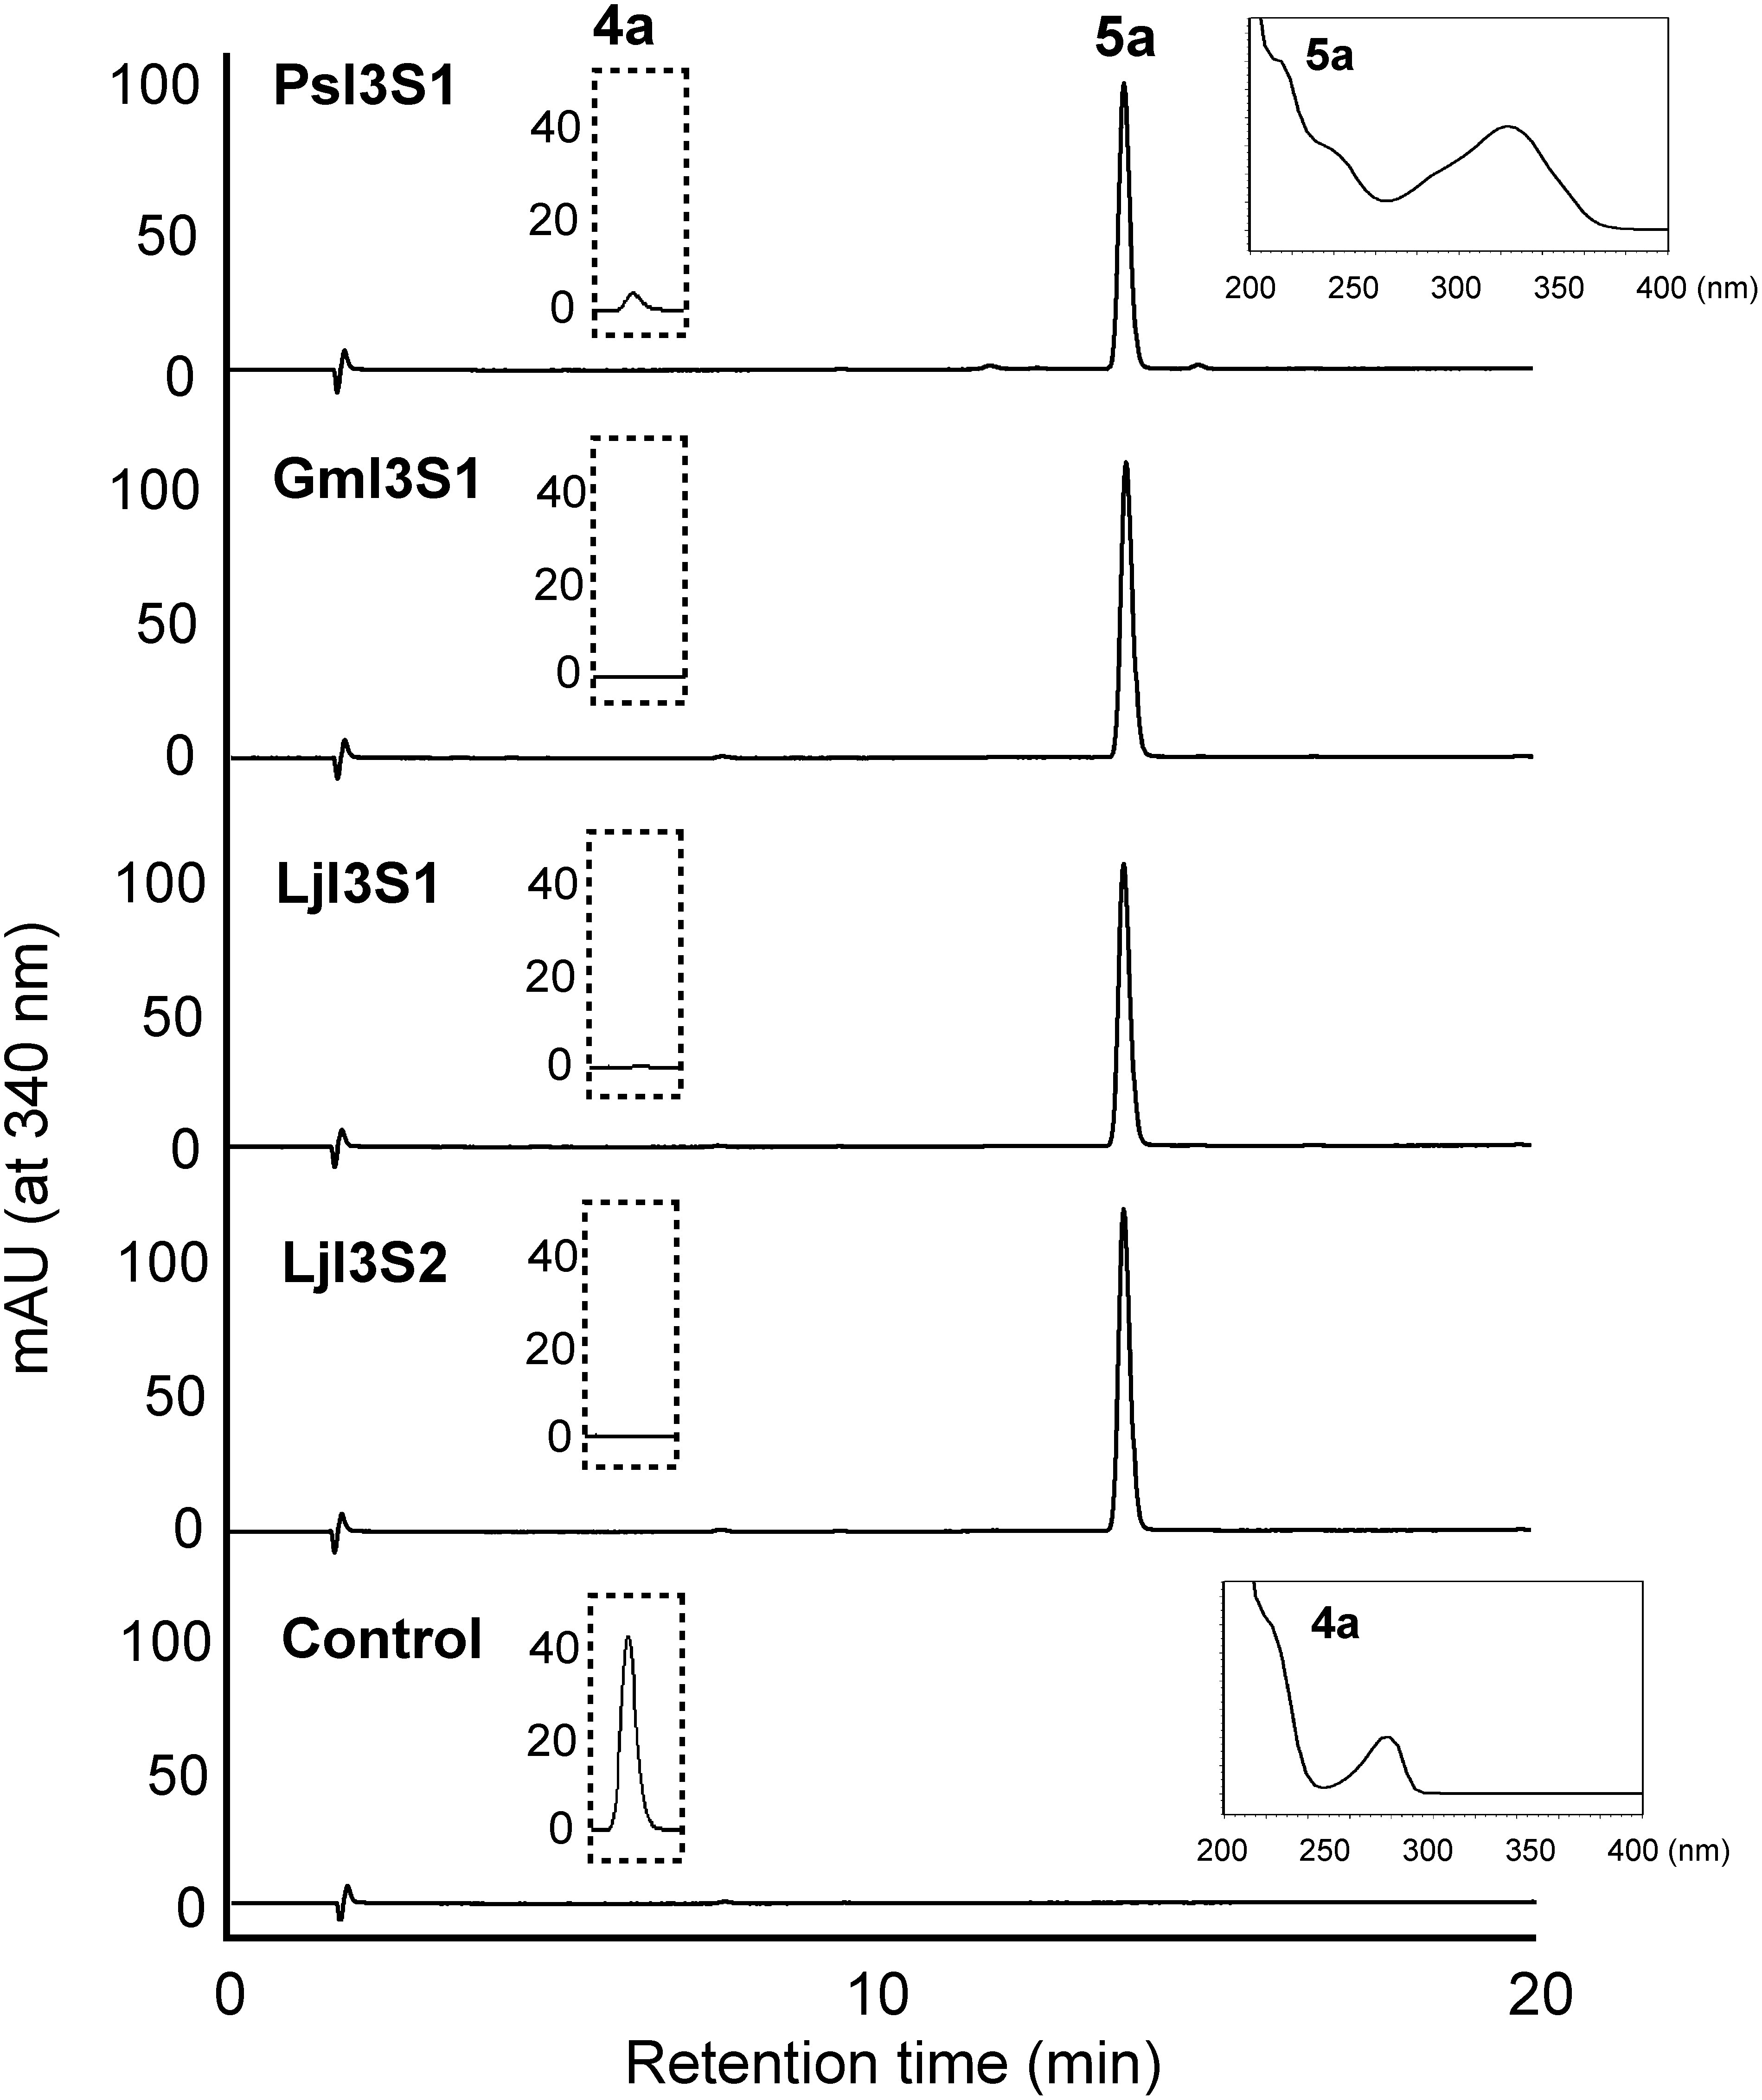
Figure 2. HPLC elution profiles of the products of recombinant I3S reactions. Affinity purified PsI3S1 and crude extracts of E. coli expressing I3S proteins of soybean (GmI3S1) and L. japonicus (LjI3S1 and LjI3S2) were reacted with (3R,4R)-DMI (4a), and ethyl acetate extracts of the reaction mixtures were analyzed. Because the maximum absorbances of the substrate (λmax 280 nm, retention time 5.6 min) and product (5a, λmax 340 nm, retention time 13.8 min) are largely different, the substrate was not detected in this chromatogram. The ordinate scales of the HPLC charts are equal. The eluates (retention times 5.0 to 6.0 min) monitored at 280 nm are shown in the dotted line frame, and the ordinate scales represent mAU. UV spectra of the product (5a) by PsI3S1 reaction and the substrate (4a) are shown in the line frame. A crude extract of E. coli transformed with pET-21a was used as the control.