. 2020 Sep 25;37(3):301–310. doi: 10.5511/plantbiotechnology.20.0421a

Figure 4. Time course of (+)-pisatin accumulation (A) and transcript levels of the biosynthetic genes (B) in pea cotyledon upon CuCl2 treatment. Data are expressed as mean±SE (n=3 biological replicates). Transcript levels were analyzed using the ΔΔCt method. β-Tubulin was used as the internal standard. Transcript levels were normalized to those of non-treated cotyledons (at 0 h).
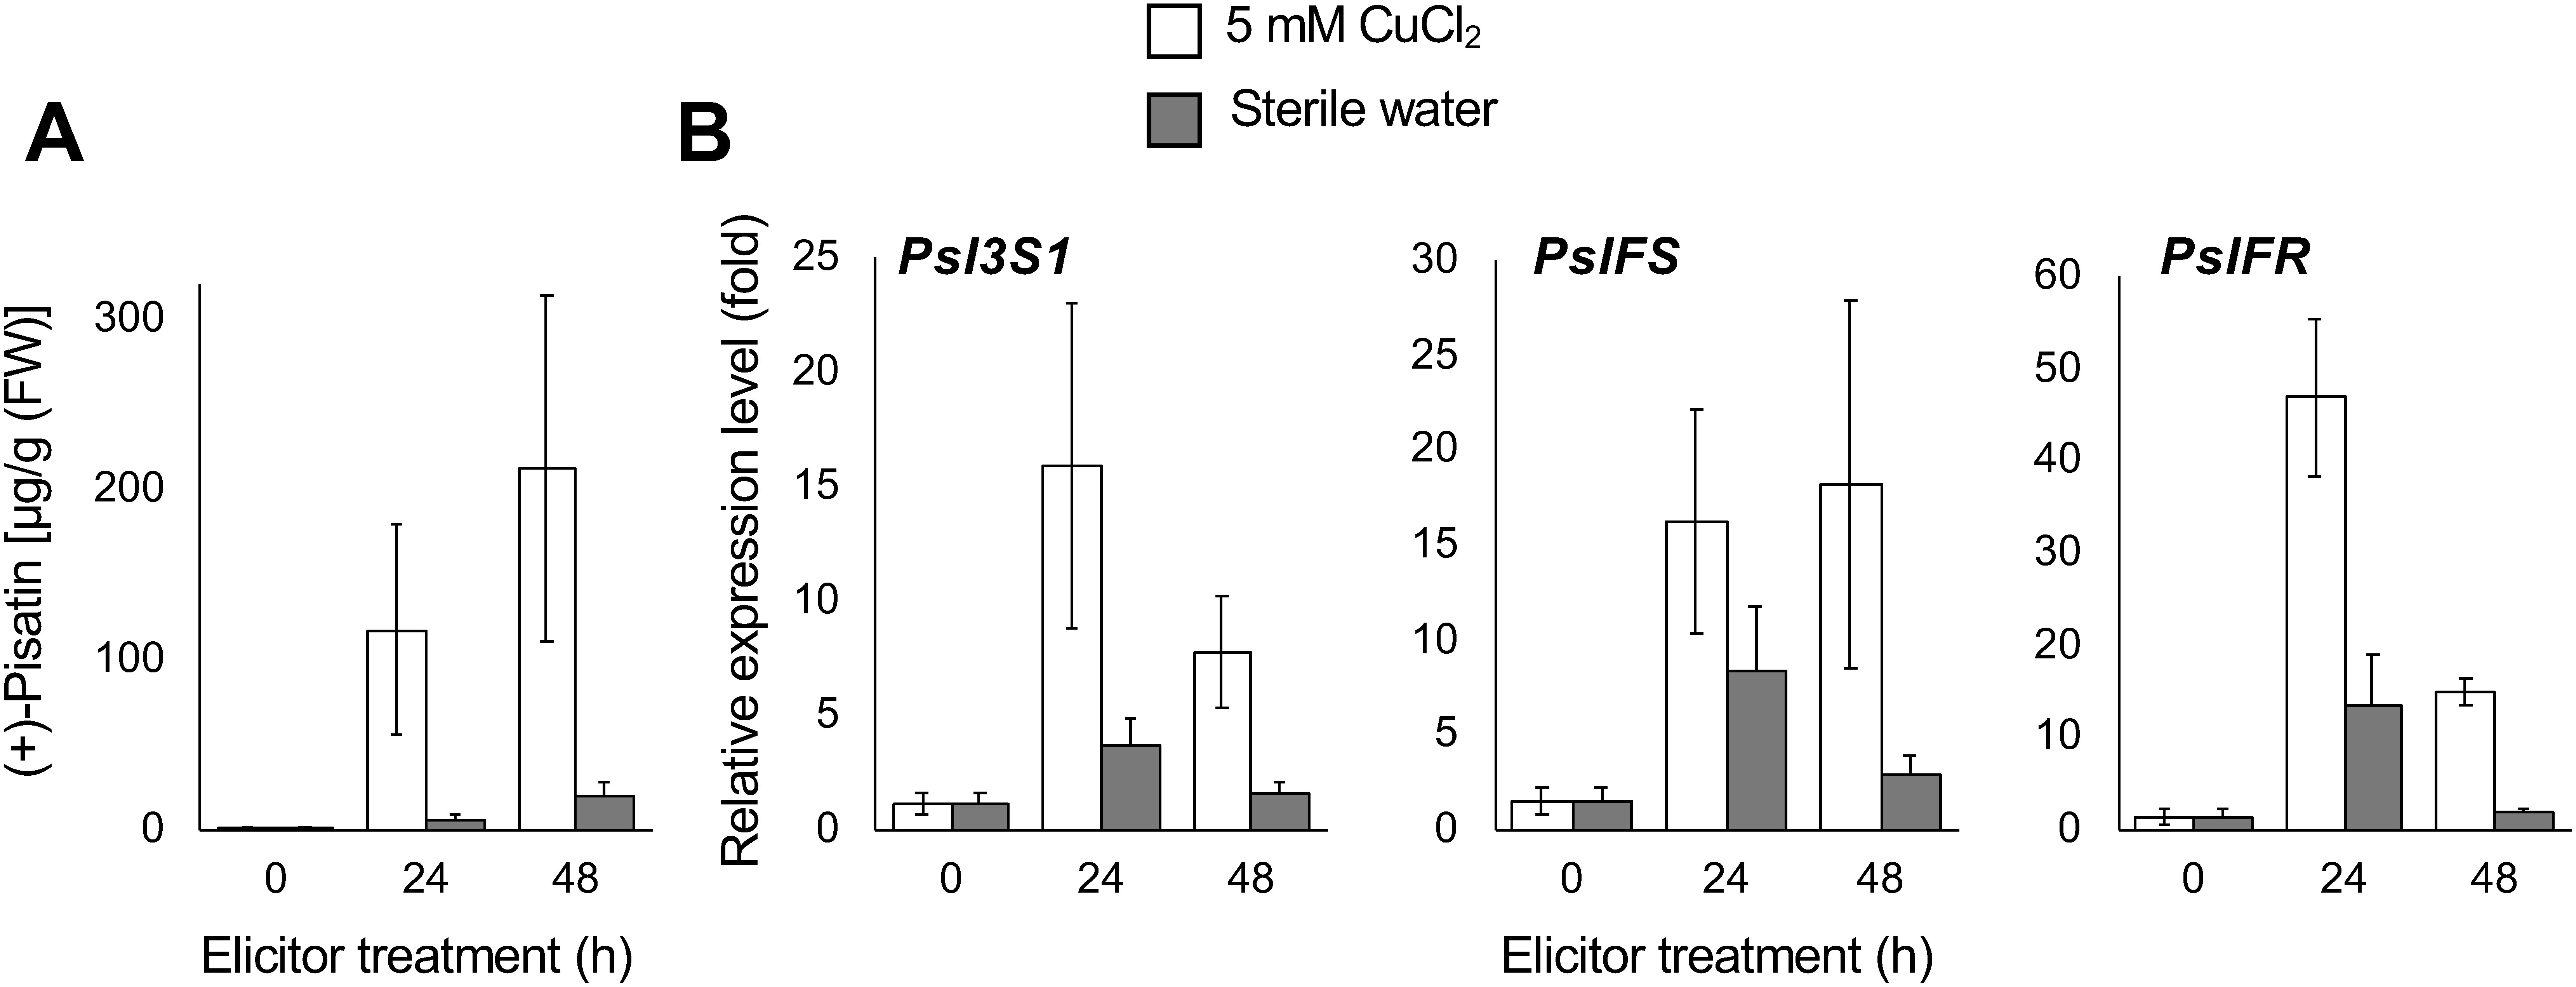
Figure 4. Time course of (+)-pisatin accumulation (A) and transcript levels of the biosynthetic genes (B) in pea cotyledon upon CuCl2 treatment. Data are expressed as mean±SE (n=3 biological replicates). Transcript levels were analyzed using the ΔΔCt method. β-Tubulin was used as the internal standard. Transcript levels were normalized to those of non-treated cotyledons (at 0 h).