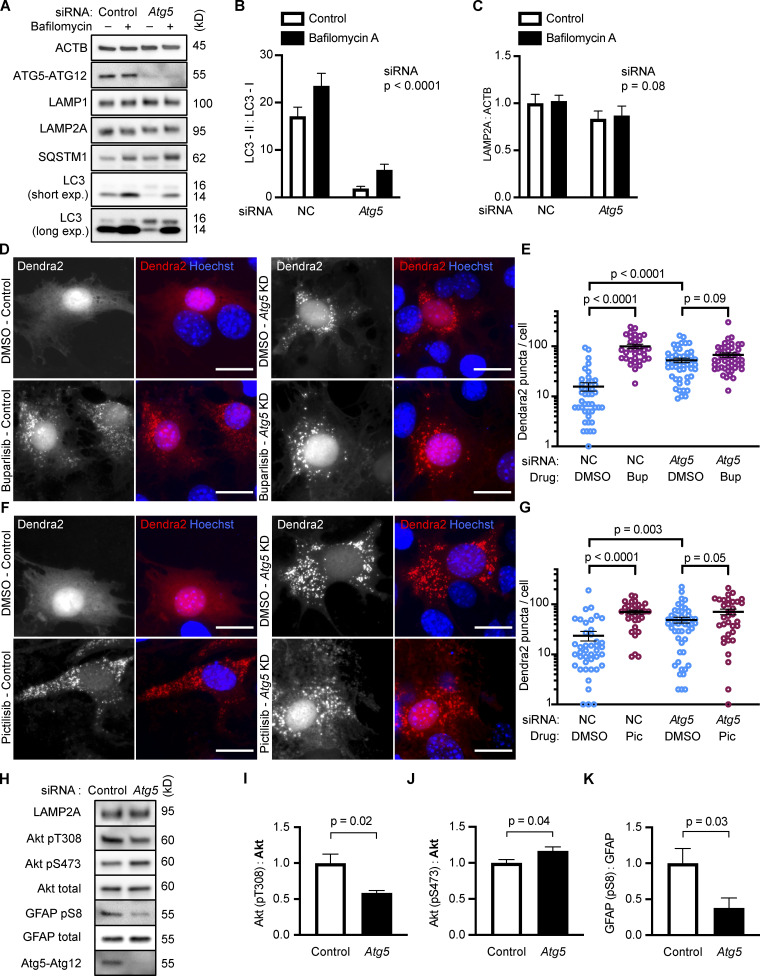
Figure 4.
NIH3T3 cells with reduced Atg5 have increased CMA. Knocking down Atg5 significantly reduced LC3-I to LC3-II conversion (A and B), but did not significantly change LAMP2A levels (A and C), n = 6. NIH3T3 cells were treated with a negative control (NC) or Atg5 siRNA before being treated with DMSO, buparlisib (D and E), or pictilisib (F and G). For D–G, data were pooled from at least three independent experiments. Knocking down Atg5 was sufficient to strongly induce the formation of Dendra2 CMA reporter puncta, and this did not have a significant additive effect with buparlisib treatment (D and E) or with pictilisib treatment (F and G). In E, NC-DMSO = 45 cells, NC-Bup = 34 cells, Atg5-DMSO = 50 cells, and Atg5-Bup = 49 cells. In G, NC-DMSO = 43 cells, NC-Pic = 35 cells, Atg5-DMSO = 50 cells, and Atg5-Pic = 34 cells. Knocking down Atg5 caused changes to Akt phosphorylation (H–J) and a significant reduction in GFAP phosphorylation (H and K). For all experiments, cells were maintained in complete growth medium with 10% serum. P values above brackets are derived from unpaired t tests. For F and G, the siRNA P value to the right of each graph is derived by two-way ANOVA. Error bars are SEM. Scale bars are 20 µm. ACTB, β-Actin; Bup, buparlisib; exp., exposure; Pic, pictilisib.

