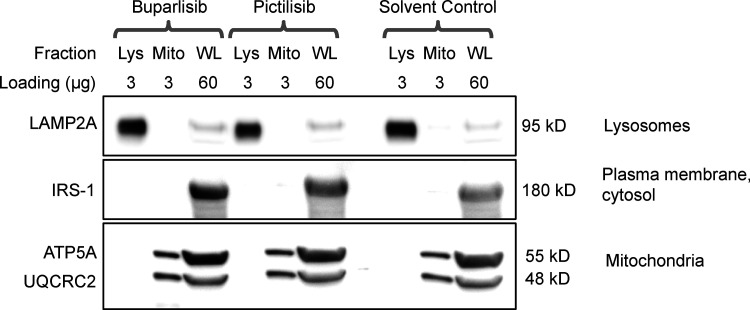
Figure S5.
Lysosomal purification quality control. There was no detectable difference in lysosomal enrichment or purity between any of the treatment groups. The subcellular localization of each protein blotted for is written to the right of the representative image. The amount of protein loaded in each well, in micrograms, is written above each lane. Lys, lysosomal fraction; Mito, mitochondrial fraction; WL, whole liver lysate.

