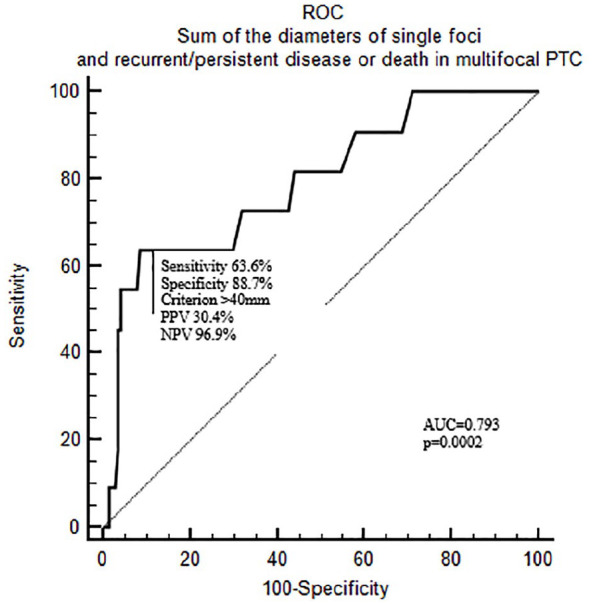
Figure 1.

ROC curve analysis on the sum of the diameters of single foci and persistent/recurrent disease or death in multifocal PTC.
AUC, area under the curve; NPV, negative predictive value; PPV, positive predictive value; PTC, papillary thyroid cancer; ROC, receiver operating characteristic.
