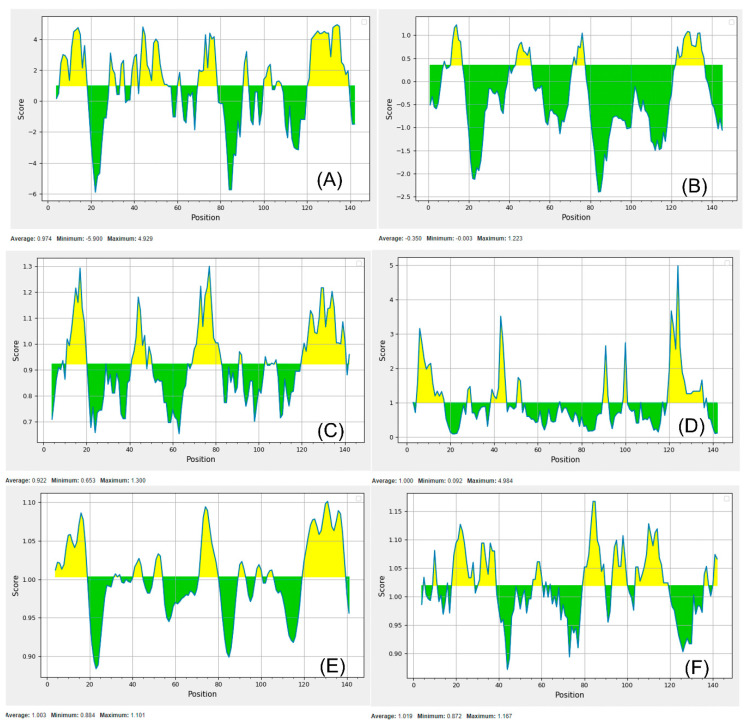
Figure 4.
B-cell epitope in the FLiS protein based on Parker hydrophilicity prediction (A). Bepipred linear epitope (B). Chou and Fasman β-turn prediction (C). Emini surface accessibility prediction (D). Karplus and Schulz flexibility prediction (E). Kolaskar and Tongaonkar antigenicity (F). The x-axis and y-axis represent the sequence position and corresponding antigenic properties score, respectively. The threshold level was set as default parameter of the server. The regions shown in yellow color above the threshold value were predicted as B-cell epitope.

