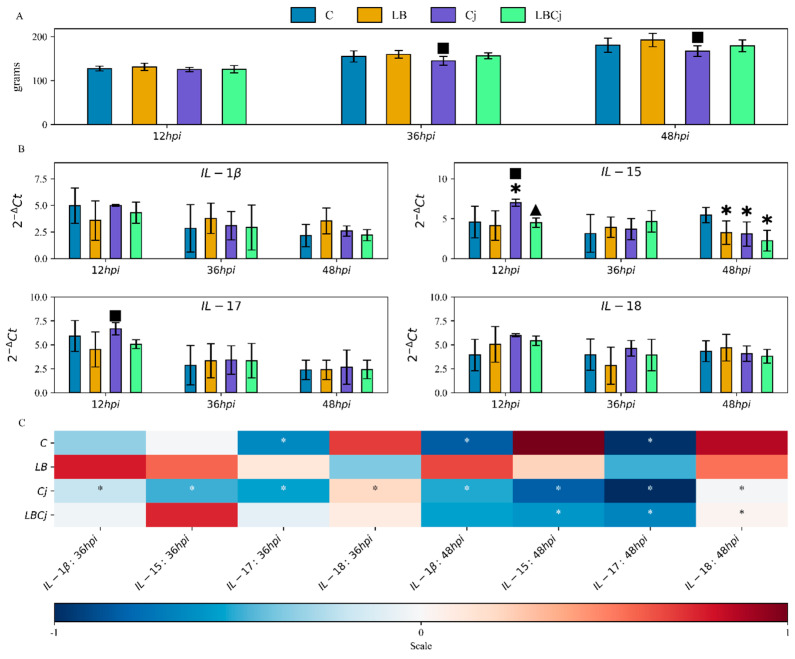
Figure 1.
Effects on body weight and pro-inflammatory cytokine expression of L. fermentum and C. jejuni colonization at three different stages. (A) Average body weights of treated and untreated animals at 12, 36 and 48 hpi. (B) mRNA expression levels of caecal pro-inflammatory cytokines at three different time points. The Ct values of studied genes were normalized to a Ct value of the reference gene (GAPDH) (Delta -Δ- Ct), and calculated as 2−ΔCt. Values are mean ± standard error SE (n = 9). * denotes significant differences (Tukey’s test, p < 0.05) with the control group; ■ with the L. fermentum treatment, ▲ with C. jejuni treatment. C, control group; LB, L. fermentum group; Cj, C. jejuni group; LBcj, co-exposure group; hpi, hour post-infection. (C) Heat map denoting transcriptional fold change between time points. The colour scale, −1 (blue) to +1 (red), denotes mRNA levels relative to the values of the control group, with white designating down-regulated genes and black designating up-regulated genes. Relative expression was calculated and expressed as 2−ΔΔCt log2 fold change. Values are mean ± SE (n = 9). * denotes significant differences (Tukey’s test, p < 0.05). C, control group; LB, L. fermentum group; Cj, C. jejuni group; LBcj, co-exposure group; hpi, hour post-infection.

