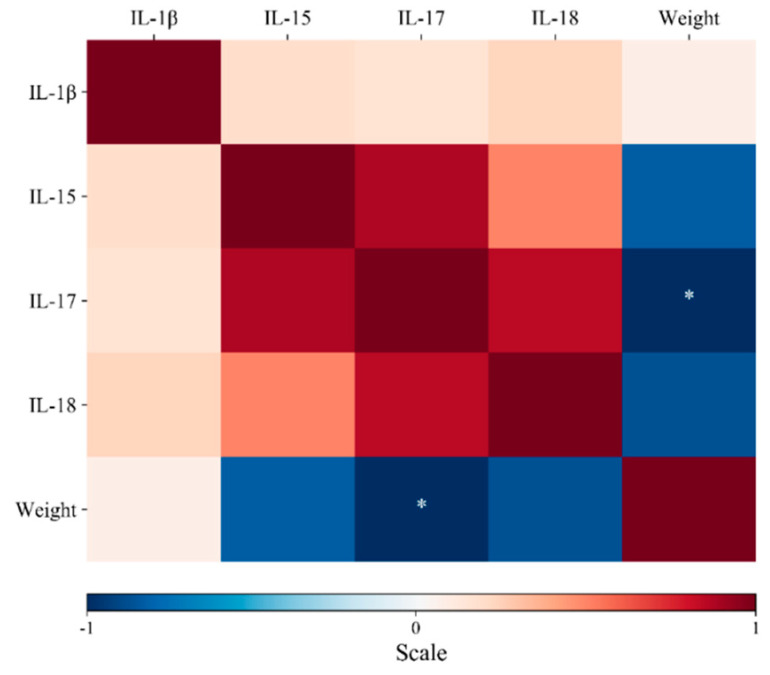
Figure 2.
Heat map representing Pearson’s r correlation coefficient matrix among the indicators. Scores are denoted in color from -1 (blue) to 1 (red). * Indicates significant differences (Tukey’s test, p < 0.05). The negative value of the coefficient implies that IL-17 and body weight are inversely related; in other words, when this cytokine is upregulated, a loss in body weight might be expected.

