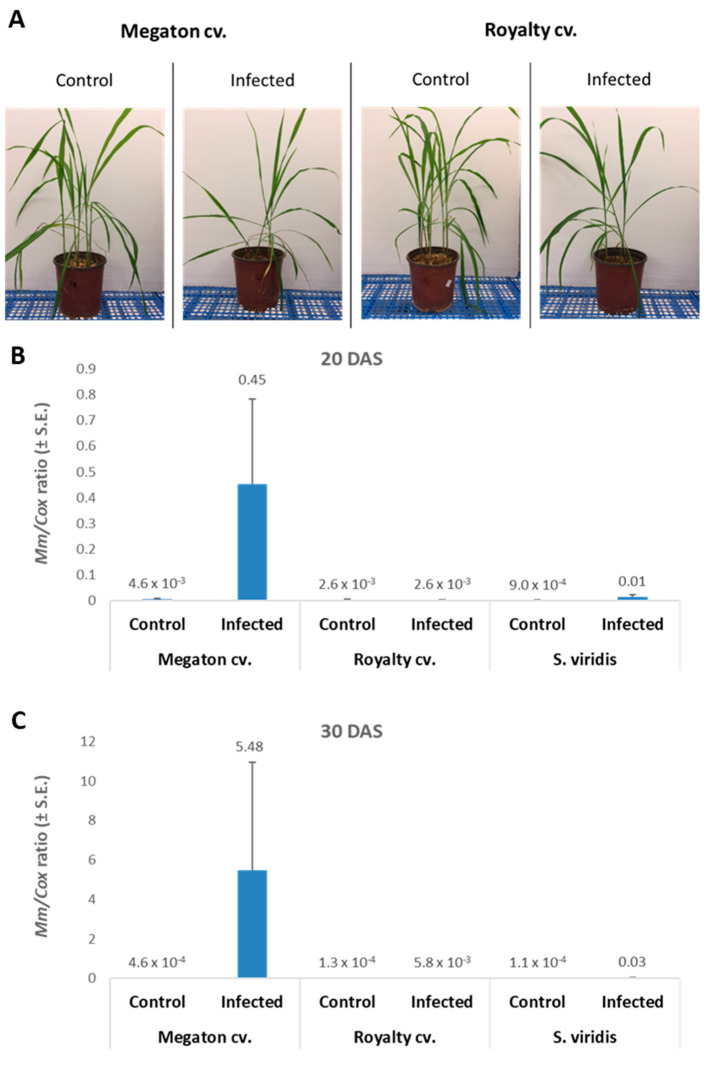
Figure 8.
Seedling pathogenicity assay: qPCR analysis. A. Pictures of representative plants from the experiment described in Figure 6 were taken 30 DAS. The plants were tested for the presence of M. maydis DNA inside their root tissues 20 (B) and 30 (C) post-sowing. The maize varieties (Megaton cv. and Royalty cv.) evaluation was compared to the pathogen DNA variations within the roots of Setaria viridis (green foxtail), a recently discovered new host of this fungus [18]. The S. viridis plants were grown under the same condition for the same periods as the maize cultivars. The y-axis parameters are M. maydis relative DNA (Mm) levels normalized to the cytochrome c oxidase (Cox) DNA. Vertical upper bars signify the standard error of the mean of three repeats (plants).

