Figure 1.
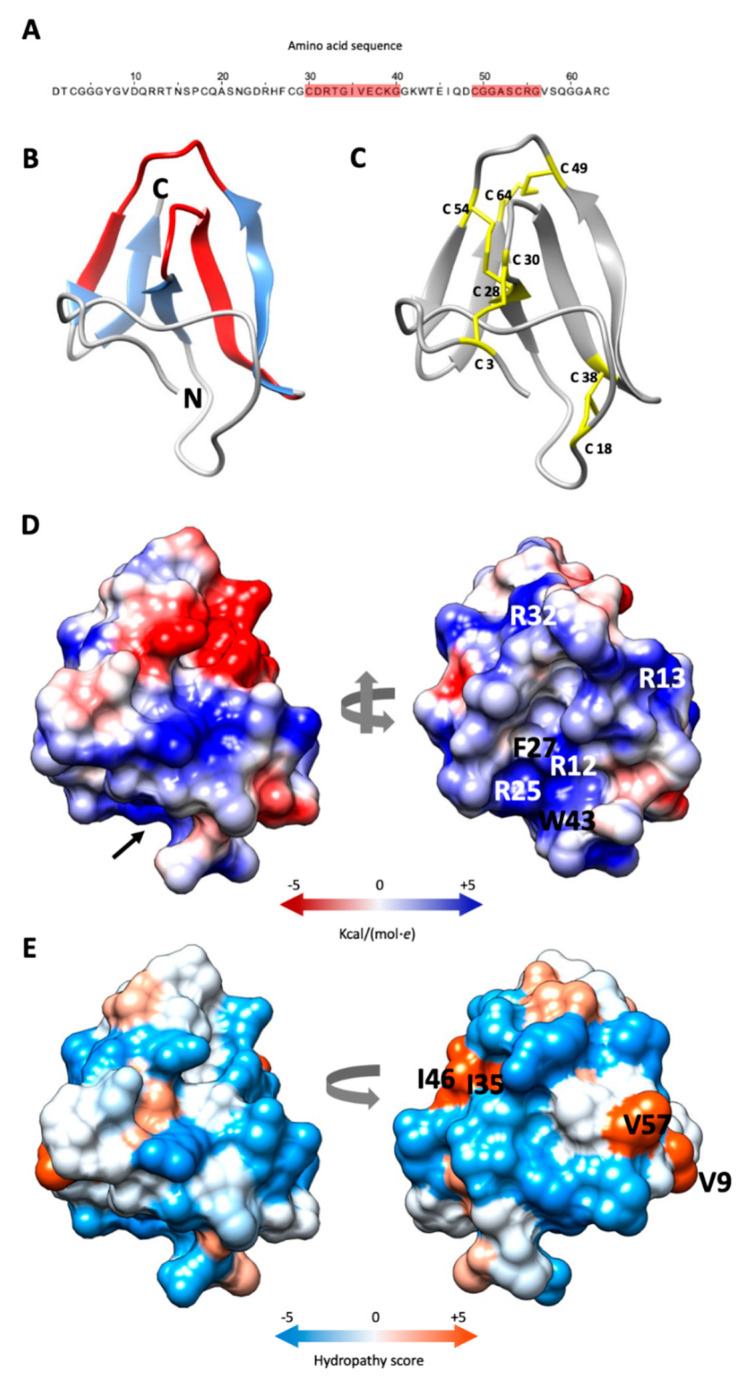
Predicted structure of PAFC. (A) Amino acid sequence (aa) of PAFC with the two predicted γ-core motifs highlighted in red. (B) Ribbon representation of PAFC in UCSF Chimera protein visualization and analysis software [21] depicting the structure of the β-strands (blue) and location of the two γ-cores (red), the N- and C-terminus is indicated. (C) Disulfide bonding of PAFC is shown with yellow sticks. (D) Surface representation of PAFC in two orientations colored according to electrostatic potential (blue: electropositive, red: electronegative). The model depicted on the right side visualizes the “mouth-like” cavity indicated by a black arrow in the left model. The basic aas surrounding the opening and the aa forming the funnel base are indicated. (E) Distribution of hydrophobic and hydrophilic patches on the surface of PAFC in two orientations colored according to the Kyte-Doolittle scale (blue: hydrophilic, orange: hydrophobic). The aas forming the hydrophobic patches are indicated in the model on the right.

