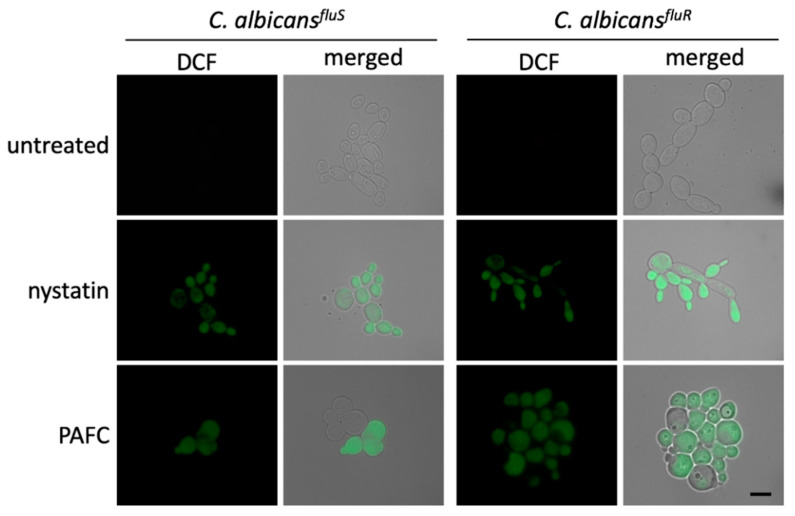
Figure 7.
Induction of iROS by PAFC. Fluorescence microscopy of DCF-positive C. albicansfluS and C. albicansfluR cells to visualize iROS burden after exposure to 1 × IC90 (2.5 µM) PAFC for 8 h at 30 °C and continuous shaking at 160 rpm. The samples were washed in PBS before incubation for 30 min with H2DCFDA (5 ng μL−1). Excess of fluorescent dye was removed by washing in PBS and the cells were mounted on glass slides for evaluation of iROS induction by fluorescence microscopy. Cells without treatment and exposed to nystatin (10 µg mL−1) were used as negative and iROS-positive controls, respectively. The merged images show the DCF signal (green) superimposed with the Candida cells visualized with brightfield microscopy. One representative experiment out of three independent experiments is shown. Scale bar, 5 μm.

