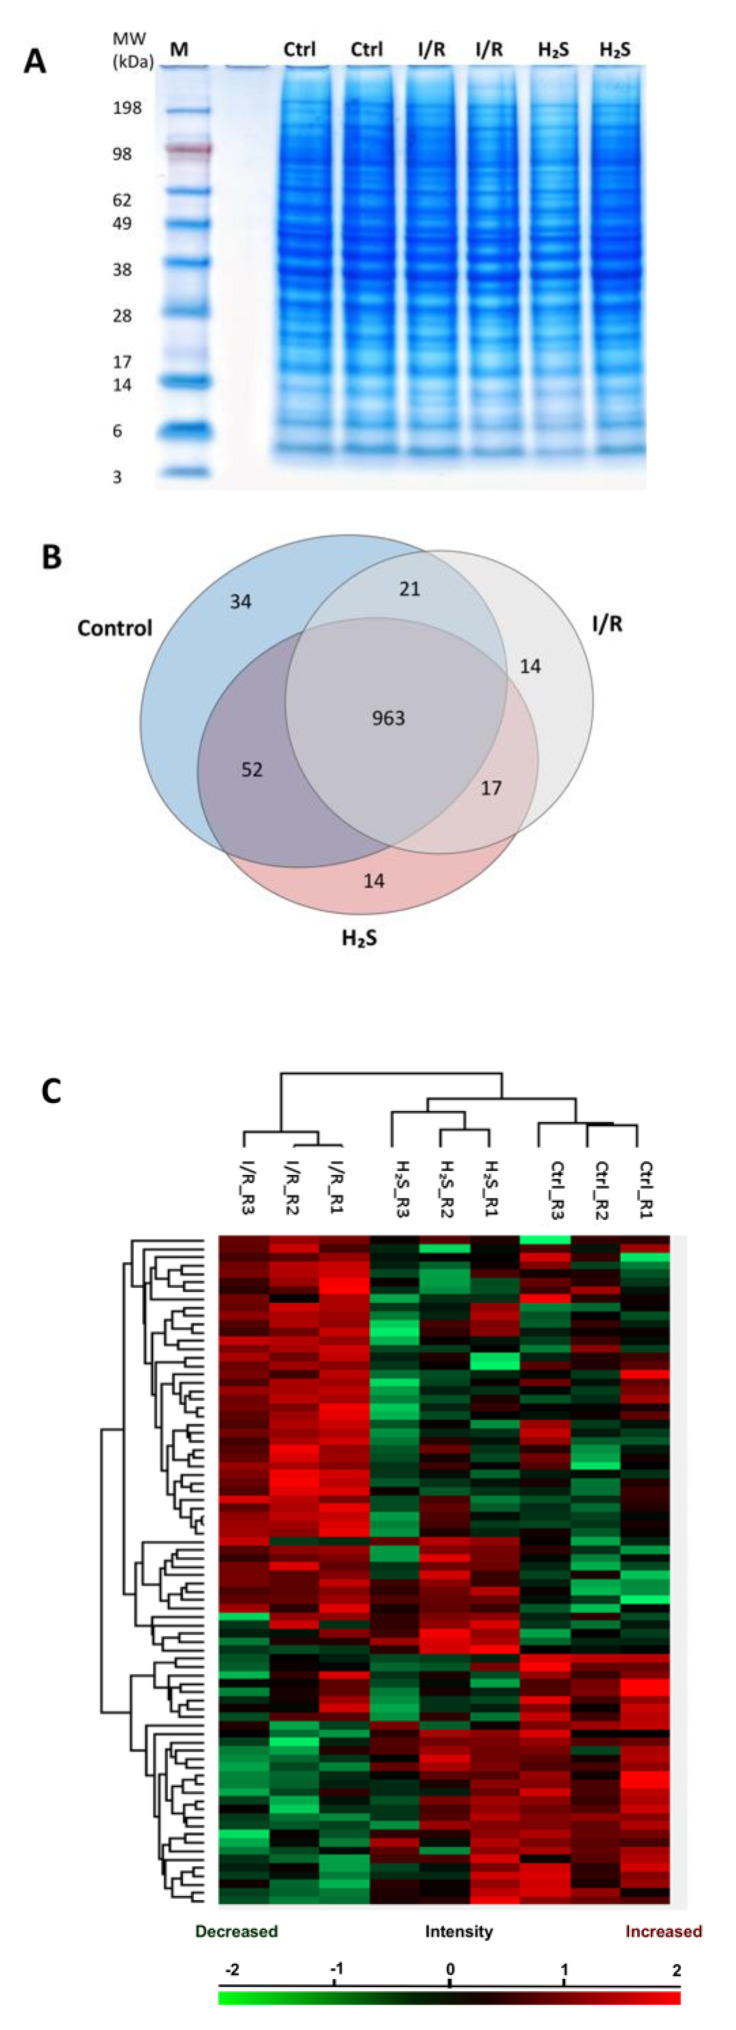
Figure 2.
Retinal proteome of Ischemia-reperfusion (I/R) injured and H2S pre-treated retinae. (A) Representative retinal protein profiles of both I/R injured and H2S pre-treated retinae compared to non-operated retinae (designated as CTRL) resolved in PAGE gel stained with colloidal blue. M: marker. (B) Venn diagram depicting overlaps of identified retinal proteins in I/R injured and H2S pre-treated groups compared to the control group. (C) Heat map depicts the hierarchical clustering of the differentially expressed retinal proteins in I/R injured and H2S pre-treated group compared to the control group, H2S pre-treat group demonstrated a more similar protein makeup to the control group (detailed list of proteins can also be found in Supplementary Data S2).

