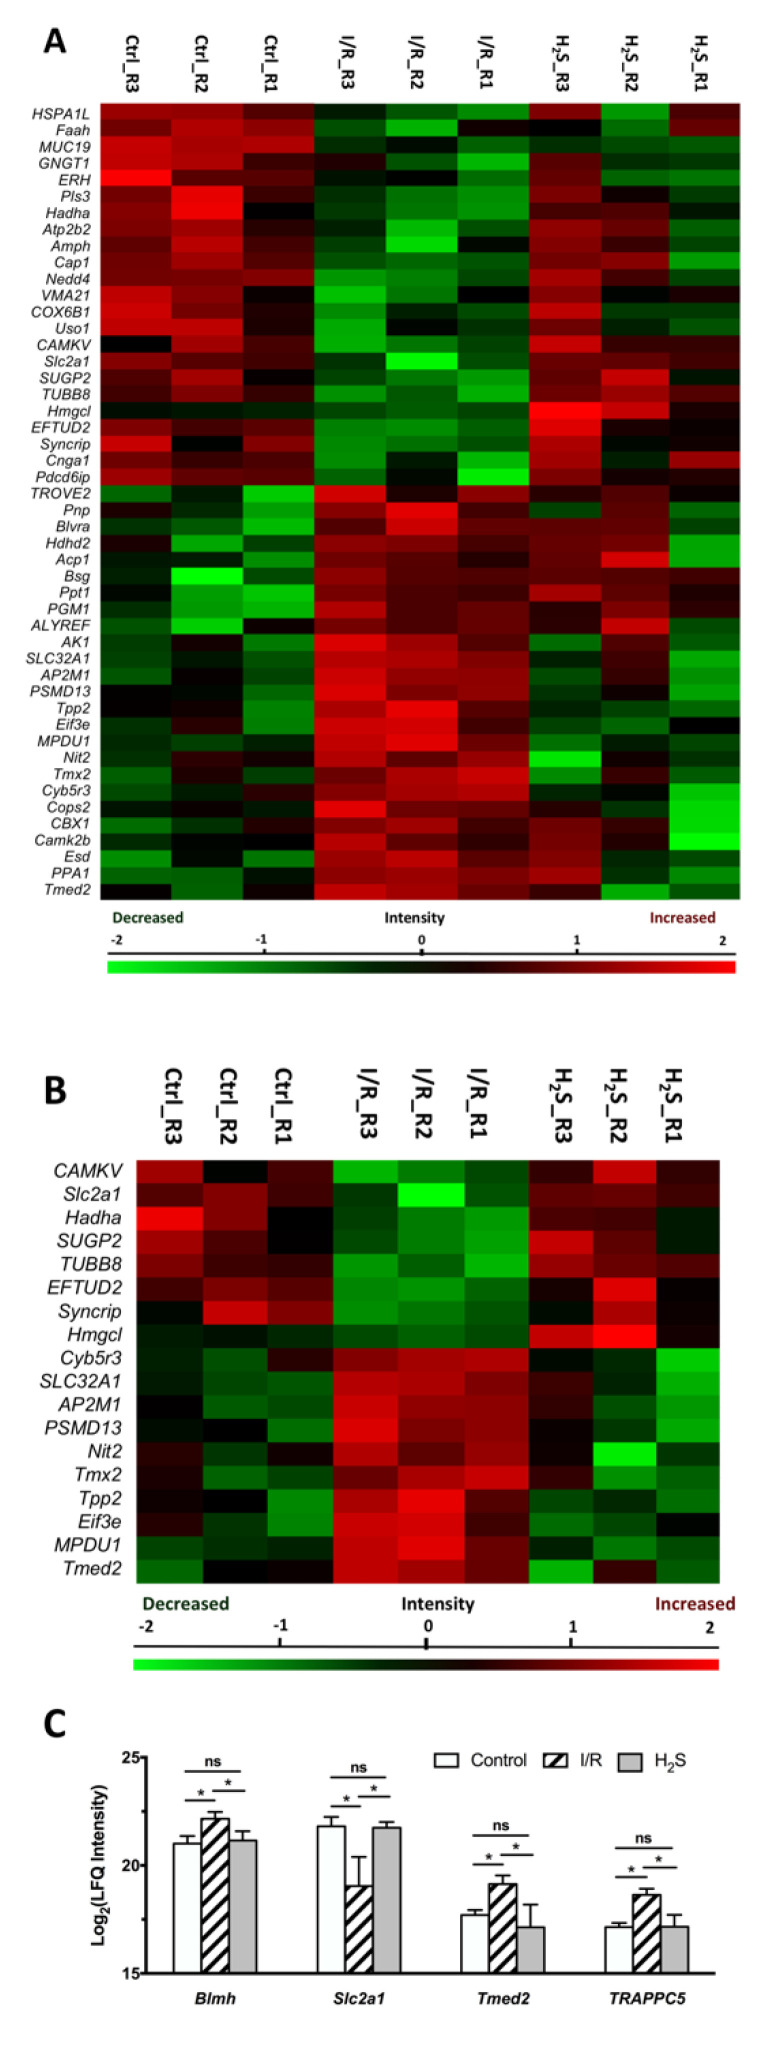
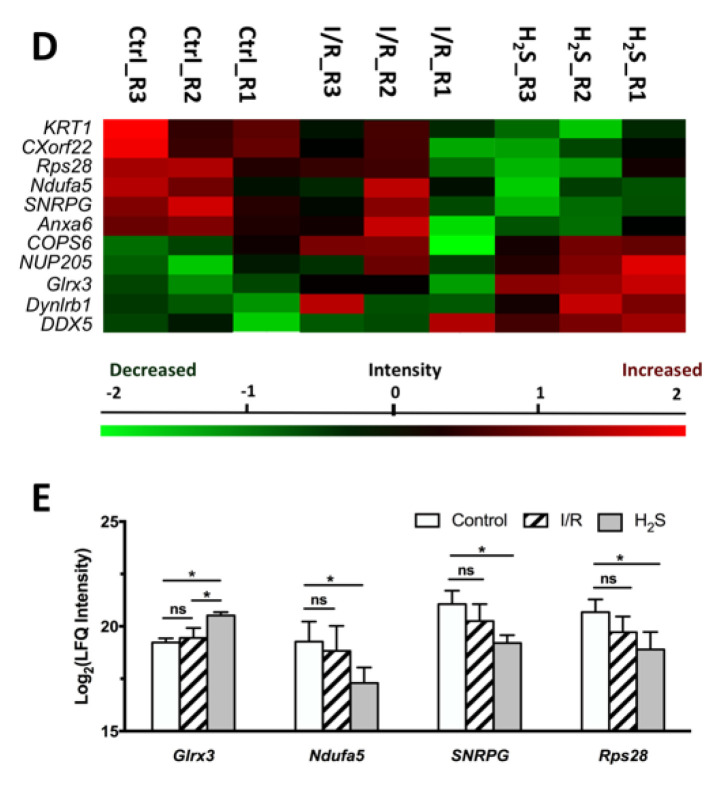
Figure 3.
Differential expression profiles of retinal proteins in control, I/R and H2S. The relative protein abundance is represented as heat maps of each protein clusters. (A) A cluster of 48 proteins, the abundance of which were significantly altered due to I/R injury (also see Table 1); (B) a cluster of 18 proteins, the abundance of which were significantly altered due to I/R injury and restored by H2S (Table 2); (D) a cluster of 11 proteins, which were significantly differentially expressed in H2S group (Table 3). Charts showing the different expression profiles of (C) some of the significantly (* p < 0.05) dysregulated proteins in I/R group that were restored due to administration of H2S, (E) some of the significantly differentially expressed retinal proteins in H2S group.


