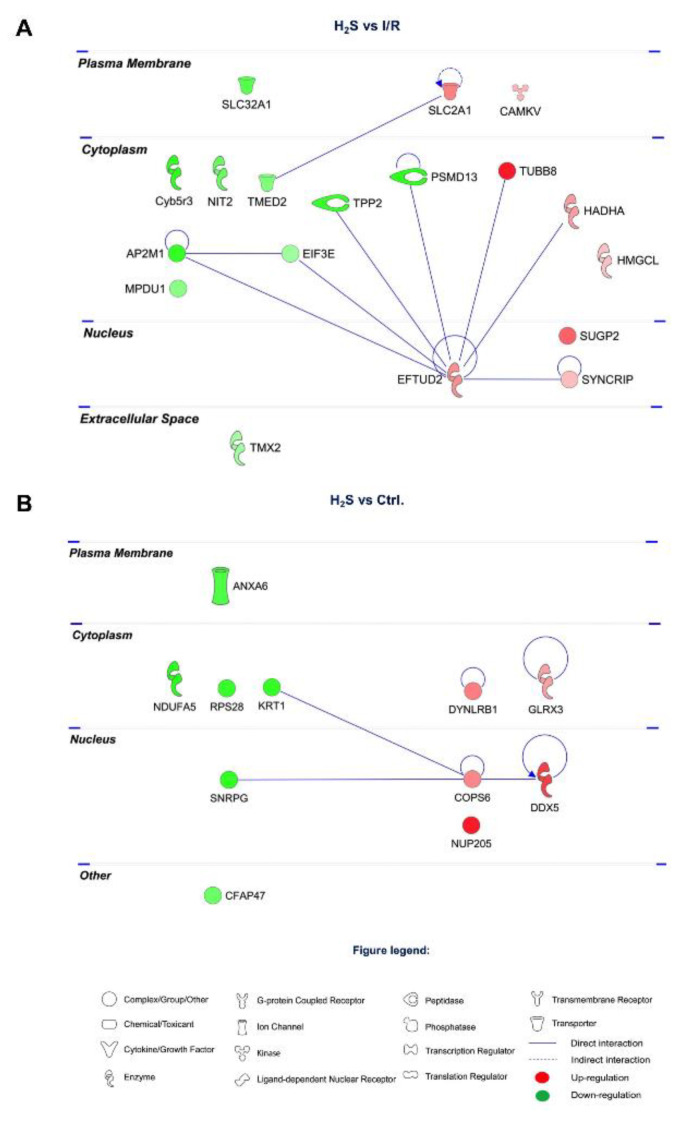
Figure 5.
Protein–protein interaction networks of the differentially expressed retinal proteins modulated by H2S. (A) 18 proteins restored by H2S comparing to I/R group. (B) 11 differentially expressed retinal proteins modulated by H2S comparing to CTRL group. The major interaction networks of restored retinal proteins obtained by IPA analysis in H2S group.

