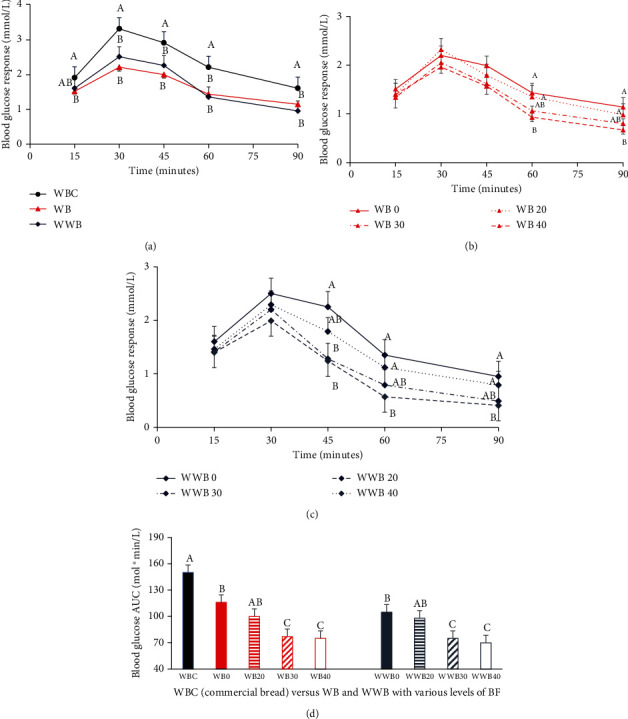
Figure 3.

Effect of bread consumption on blood glucose concentration over time for 90 minutes in healthy volunteers. (a) Blood glucose concentration response to white bread, whole wheat bread, and wheat bread purchased from the market. (b) Blood glucose concentration in response to chickpea flour substituted at various ratios to white bread. (c) Blood glucose concentration in response to chickpea flour substituted at various ratios to whole wheat bread. (d) Blood glucose concentration under the area under the curve (AUC) in response to chickpea flour substituted at various ratios to white flour bread and whole wheat bread compared to commercial wheat bread. Data is presented as mean ± SEM (n = 15). (a–c) Values within the same time points are significant at p < 0.05. (d) Different superscript letters on the bars represent differences among the breads at p < 0.05. Legends: WBC = wheat bread commercial (from the supermarket); WB = white bread; WWB = whole wheat bread; WB/WWB 0, 20, 30, and 40 refer to chickpea flour substitution at 0 (control), 20%, 30%, and 40% level to white flour or whole wheat flour.
