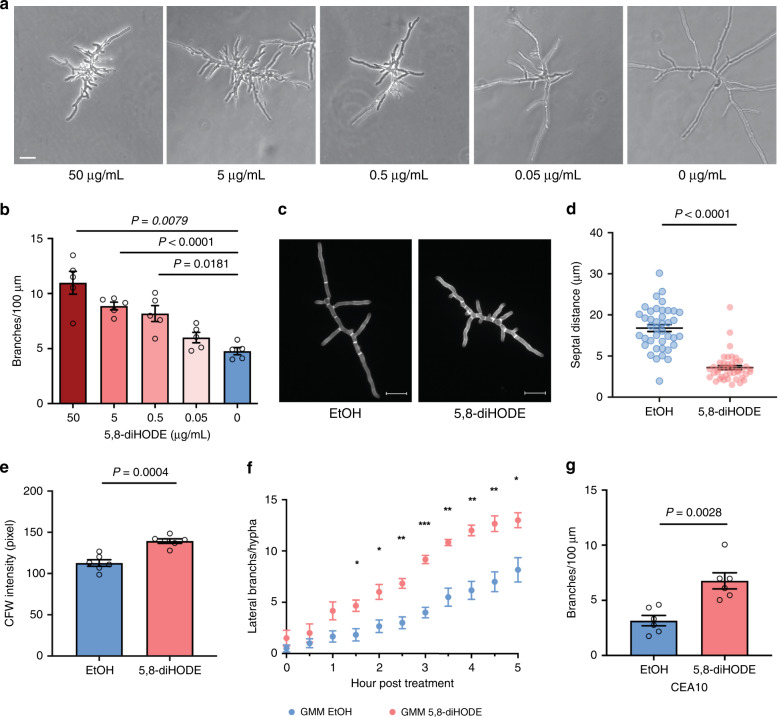
Fig. 2. 5,8-diHODE induces lateral branching and increased septa formation in A. fumigatus wild-type strains.
a Microscopic images of A. fumigatus Af293 WT grown in GMM containing either EtOH (0 µg/mL) or 5,8-diHODE at 0.05, 0.5, 5, and 50 µg/mL for 20 h in microfluidic wells. Images are representative of five microscopic images acquired for each treatment. Scale bar represents 20 µm. b A dose–response curve of hyphal branching at different concentrations of 5,8-diHODE (n = 5). The degree of branching is represented by the number of lateral branches/100 µm apical hyphal length at 20 h post inoculation. Af293 spores were incubated with GMM containing EtOH or 5,8-diHODE for 15 h to germinate, and five randomly selected young hyphae across four microfluidic wells were tracked with time-lapse microscopy every 15 min for 5 h. c Representative images of calcofluor white (CFW)-stained Af293 WT hyphae grown in GMM with EtOH or 5 µg/mL 5,8-diHODE for 14 h in a 24-well plate. Images are representative of six microscopic images acquired for each treatment. Scale bars represent 20 µm. d Distances between adjacent septa in EtOH (n = 40) and 5,8-diHODE-treated hyphae (n = 43) when six randomly selected hyphae from three wells were analyzed. n represents the number of septal distances. e Quantification of CFW signal in the six selected hyphae analyzed in (d). f The number of emerging lateral branches per hypha when growing hyphae of the Af293 WT strain were exposed to 5 µg/mL 5,8-diHODE (n = 6). Hyphae were grown in GMM containing EtOH for 15 h and transferred to GMM either with EtOH or GMM with 5 µg/mL 5,8-diHODE, followed by time-lapse imaging of six hyphae across four microfluidic wells. g Branching response to 5 µg/mL 5,8-diHODE in another commonly used A. fumigatus clinical isolate, CEA10 (n = 6). Six randomly selected hyphae grown in four microfluidic wells were imaged every 15 min for 5 h. Brown–Forsythe and Welch ANOVA tests were performed, followed by Dunnett’s T3 multiple comparison test between each treatment group and the no oxylipin control group in (b). Welch’s two-sided t tests were used for two group comparisons in (d, e, g). Multiple two-sided t tests were performed to compare between the treatment groups in each time point in (f). All values represent mean ± SEM.

