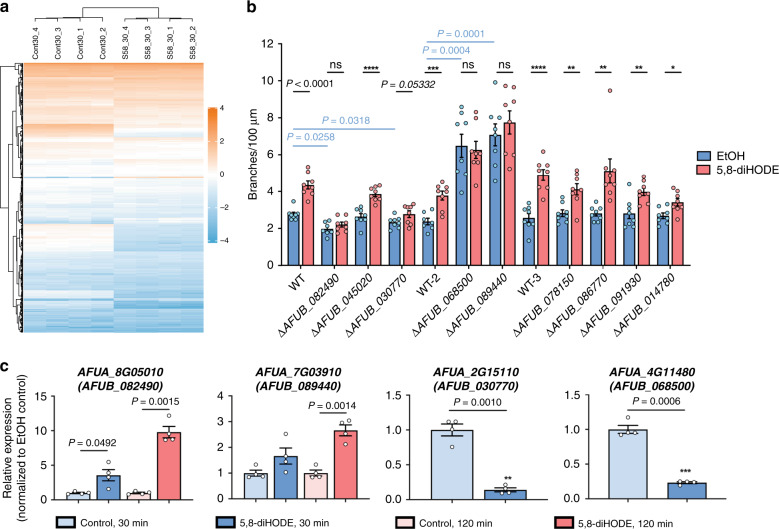
Fig. 5. Global response to 5,8-diHODE and transcriptional regulators involved in 5,8-diHODE-induced branching.
a Hierarchical clustering analysis of differentially expressed genes (DEGs) with FDR < 0.05 and |log2FC|>1 at 30 min post treatment from RNA-seq experimentation. The log2FPKM (fragments per kilobase of transcript per million mapped reads) were used to construct the heatmap using the ComplexHeatmap package in RStudio. Cont_30: EtOH controls at 30 min; S58_30: 5,8-diHODE treated samples at 30 min. b Microfluidic-based screen of transcription factor (TF) mutants (n = 7 for ΔAFUB_082490 and WT-2 in EtOH group, and n = 8 for the rest). Nine TF mutants from the first round of the screen were evaluated for branching in GMM containing EtOH or 5,8-diHODE (5 µg/mL) in four microfluidic wells in three separate batches. A1160 pyrG+ WT control was used as a positive control for each batch. For each treatment group in each strain, eight hyphae randomly selected from four microfluidic wells were imaged every 15 min for 5 h. P values corresponding to asterisks (*) from left to right are: <0.0001, 0.0005, <0.0001, 0.0026, 0.0038, 0.0041, 0.0105. c Expression of AFUA_8G05010 and AFUA_7G03910 at 30- and 120 min post treatment and AFUA_2G15110 and AFUA_4G11480 at 30 min post treatment (n = 4) through quantitative real-time PCR (qRT-PCR). The total RNA was extracted from four separate cultures that were either exposed to 0.005% EtOH or 5,8-diHODE (5 µg/mL), digested with DNase, and reverse-transcribed for SYBR-based real-time PCR. Expression of each gene in 5,8-diHODE-treated samples was normalized to its expression in the respective EtOH controls, which is set to 1. Multiple two-sided t tests were used to compare between treatments within each strain while Brown–Forsythe and Welch ANOVA tests were performed, followed by Dunnett’s T3 multiple comparison test between strains within in EtOH group in (b). Welch’s two-sided t tests were used to compare between treatment groups within the same time point in (c). All values represent mean ± SEM. ns not significant (P > 0.05).

